
Page 357 - Vibrational Spectroscopic Imaging for Biomedical Applications
P. 357
T issue Imaging with CARS Micr oscopy 331
nonresonant background and sensitively extracts the vibrationally
6
resonant CARS signal, producing sensitivities of less than 10 Raman
oscillators in the presence of a considerable nonresonant background. 54
Techniques like FM-CARS have the potential to detect sub-mM con-
centrations of Raman active agents in actual tissues.
Is CARS a suitable technique for single molecule vibrational spec-
troscopy? In case of collective Raman modes, such that can be found
in carbon nanotubes, CARS signals can certainly be generated from
single structures. In the limit of a single local mode, many of the ben-
efits of CARS disappear. In particular, the coherent addition of emit-
ting Raman oscillators, producing strong signals in phase-matched
direction, no longer applies to the single oscillator limit. A theoretical
analysis shows that the CARS response is not necessarily stronger
than the spontaneous Raman response in this limit, as the emission is
essentially incoherent. 72,73
These considerations illustrate that CARS microscopy in the sin-
gle molecule limit requires additional enhancement mechanisms to
generate detectable signals. Motivated by the success of surface-
enhanced Raman scattering (SERS), 74,75 researchers have started stud-
ies in which the enhanced local fields associated with surface
plasmons of metallic substrates are used to boost the CARS response.
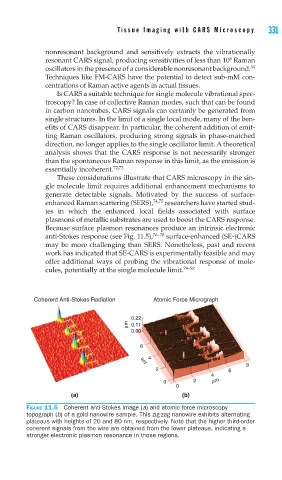
Because surface plasmon resonances produce an intrinsic electronic
anti-Stokes response (see Fig. 11.5), 76–78 surface-enhanced (SE-)CARS
may be more challenging than SERS. Nonetheless, past and recent
work has indicated that SE-CARS is experimentally feasible and may
offer additional ways of probing the vibrational response of mole-
cules, potentially at the single molecule limit. 79–82
Coherent Anti-Stokes Radiation Atomic Force Micrograph
0.22
μm 0.11
0.00
6
4
μm
8
2 6
4
0 2 μm
0
(a) (b)
FIGURE 11.5 Coherent anti-Stokes image (a) and atomic force microscopy
topograph (b) of a gold nanowire sample. This zig-zag nanowire exhibits alternating
plateaus with heights of 20 and 80 nm, respectively. Note that the higher third-order
coherent signals from the wire are obtained from the lower plateaus, indicating a
stronger electronic plasmon resonance in those regions.