
Page 234 - Materials Chemistry, Second Edition
P. 234
CAT3525_C07.qxd 1/29/2005 9:57 AM Page 205
Municipal Solid Waste Processing; Materials Recovery Facilities 205
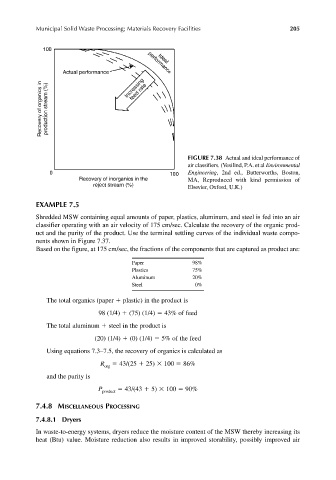
FIGURE 7.38 Actual and ideal performance of
air classifiers. (Vesilind, P.A. et al Environmental
Engineering, 2nd ed., Butterworths, Boston,
MA, Reproduced with kind permission of
Elsevier, Oxford, U.K.)
EXAMPLE 7.5
Shredded MSW containing equal amounts of paper, plastics, aluminum, and steel is fed into an air
classifier operating with an air velocity of 175 cm/sec. Calculate the recovery of the organic prod-
uct and the purity of the product. Use the terminal settling curves of the individual waste compo-
nents shown in Figure 7.37.
Based on the figure, at 175 cm/sec, the fractions of the components that are captured as product are:
Paper 98%
Plastics 75%
Aluminum 20%
Steel 0%
The total organics (paper plastic) in the product is
98 (1/4) (75) (1/4) 43% of feed
The total aluminum steel in the product is
(20) (1/4) (0) (1/4) 5% of the feed
Using equations 7.3–7.5, the recovery of organics is calculated as
R org 43/(25 25) 100 86%
and the purity is
P product 43/(43 5) 100 90%
7.4.8 MISCELLANEOUS PROCESSING
7.4.8.1 Dryers
In waste-to-energy systems, dryers reduce the moisture content of the MSW thereby increasing its
heat (Btu) value. Moisture reduction also results in improved storability, possibly improved air