
Page 94 - Materials Chemistry, Second Edition
P. 94
CAT3525_C04.qxd 1/27/2005 11:12 AM Page 65
Characterization of Solid Waste 65
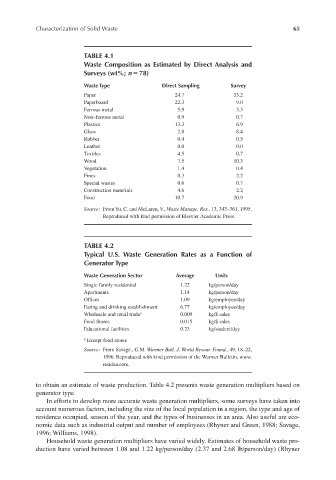
TABLE 4.1
Waste Composition as Estimated by Direct Analysis and
Surveys (wt%; n 78)
Waste Type Direct Sampling Survey
Paper 24.7 33.2
Paperboard 22.3 9.0
Ferrous metal 5.9 3.3
Non–ferrous metal 0.9 0.7
Plastics 13.3 6.9
Glass 2.8 8.4
Rubber 0.4 0.5
Leather 0.0 0.0
Textiles 4.5 0.7
Wood 7.5 10.3
Vegetation 1.4 0.4
Fines 0.3 2.2
Special wastes 0.6 0.7
Construction materials 4.6 2.2
Food 10.7 20.9
Source: From Yu, C. and McLaren, V., Waste Manage. Res., 13, 343–361, 1995.
Reproduced with kind permission of Elsevier Academic Press.
TABLE 4.2
Typical U.S. Waste Generation Rates as a Function of
Generator Type
Waste Generation Sector Average Units
Single family residential 1.22 kg/person/day
Apartments 1.14 kg/person/day
Offices 1.09 kg/employee/day
Eating and drinking establishment 6.77 kg/employee/day
Wholesale and retail trade a 0.009 kg/$ sales
Food Stores 0.015 kg/$ sales
Educational facilities 0.23 kg/student/day
a Except food stores
Source: From Savage., G.M. Warmer Bull. J. World Resour. Found., 49, 18–22,
1996. Reproduced with kind permission of the Warmer Bulletin, www.
residua.com.
to obtain an estimate of waste production. Table 4.2 presents waste generation multipliers based on
generator type.
In efforts to develop more accurate waste generation multipliers, some surveys have taken into
account numerous factors, including the size of the local population in a region, the type and age of
residence occupied, season of the year, and the types of businesses in an area. Also useful are eco-
nomic data such as industrial output and number of employees (Rhyner and Green, 1988; Savage,
1996; Williams, 1998).
Household waste generation multipliers have varied widely. Estimates of household waste pro-
duction have varied between 1.08 and 1.22 kg/person/day (2.37 and 2.68 lb/person/day) (Rhyner