
Page 99 - Materials Chemistry, Second Edition
P. 99
CAT3525_C04.qxd 1/27/2005 11:12 AM Page 70
70 Waste Management Practices: Municipal, Hazardous, and Industrial
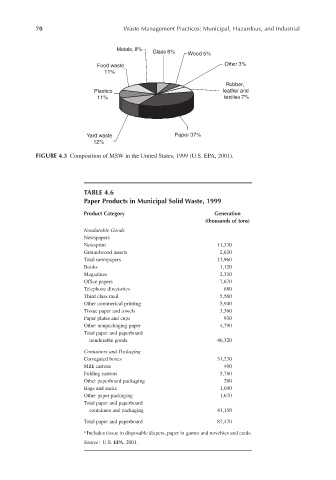
Metals, 8%
Glass 6% Wood 5%
Food waste Other 3%
11%
Rubber,
Plastics leather and
11% textiles 7%
Yard waste Paper 37%
12%
FIGURE 4.3 Composition of MSW in the United States, 1999 (U.S. EPA, 2001).
TABLE 4.6
Paper Products in Municipal Solid Waste, 1999
Product Category Generation
(thousands of tons)
Nondurable Goods
Newspapers
Newsprint 11,330
Groundwood inserts 2,630
Total newspapers 13,960
Books 1,120
Magazines 2,310
Office papers 7,670
Telephone directories 680
Third class mail 5,560
Other commerical printing 5,940
Tissue paper and towels 3,360
Paper plates and cups 930
Other nonpackaging paper 4,790
Total paper and paperboard
nondurable goods 46,320
Containers and Packaging
Corrugated boxes 31,230
Milk cartons 490
Folding cartons 5,780
Other paperboard packaging 290
Bags and sacks 1,690
Other paper packaging 1,670
Total paper and paperboard
containers and packaging 41,150
Total paper and paperboard 87,470
a Includes tissue in disposable diapers, paper in games and novelties and cards.
Source: U.S. EPA, 2001.