
Page 100 - Materials Chemistry, Second Edition
P. 100
CAT3525_C04.qxd 1/27/2005 11:12 AM Page 71
Characterization of Solid Waste 71
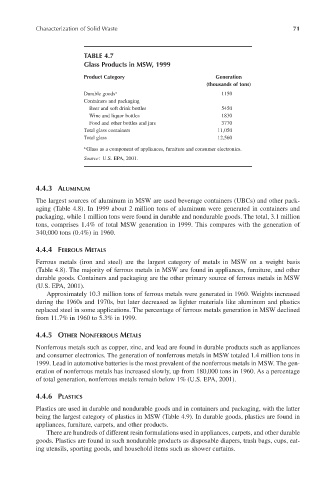
TABLE 4.7
Glass Products in MSW, 1999
Product Category Generation
(thousands of tons)
Durable goods a 1150
Containers and packaging
Beer and soft drink bottles 5450
Wine and liquor bottles 1830
Food and other bottles and jars 3770
Total glass containers 11,050
Total glass 12,560
a Glass as a component of appliances, furniture and consumer electronics.
Source: U.S. EPA, 2001.
4.4.3 ALUMINUM
The largest sources of aluminum in MSW are used beverage containers (UBCs) and other pack-
aging (Table 4.8). In 1999 about 2 million tons of aluminum were generated in containers and
packaging, while 1 million tons were found in durable and nondurable goods. The total, 3.1 million
tons, comprises 1.4% of total MSW generation in 1999. This compares with the generation of
340,000 tons (0.4%) in 1960.
4.4.4 FERROUS METALS
Ferrous metals (iron and steel) are the largest category of metals in MSW on a weight basis
(Table 4.8). The majority of ferrous metals in MSW are found in appliances, furniture, and other
durable goods. Containers and packaging are the other primary source of ferrous metals in MSW
(U.S. EPA, 2001).
Approximately 10.3 million tons of ferrous metals were generated in 1960. Weights increased
during the 1960s and 1970s, but later decreased as lighter materials like aluminum and plastics
replaced steel in some applications. The percentage of ferrous metals generation in MSW declined
from 11.7% in 1960 to 5.3% in 1999.
4.4.5 OTHER NONFERROUS METALS
Nonferrous metals such as copper, zinc, and lead are found in durable products such as appliances
and consumer electronics. The generation of nonferrous metals in MSW totaled 1.4 million tons in
1999. Lead in automotive batteries is the most prevalent of the nonferrous metals in MSW. The gen-
eration of nonferrous metals has increased slowly, up from 180,000 tons in 1960. As a percentage
of total generation, nonferrous metals remain below 1% (U.S. EPA, 2001).
4.4.6 PLASTICS
Plastics are used in durable and nondurable goods and in containers and packaging, with the latter
being the largest category of plastics in MSW (Table 4.9). In durable goods, plastics are found in
appliances, furniture, carpets, and other products.
There are hundreds of different resin formulations used in appliances, carpets, and other durable
goods. Plastics are found in such nondurable products as disposable diapers, trash bags, cups, eat-
ing utensils, sporting goods, and household items such as shower curtains.