
Page 102 - Materials Chemistry, Second Edition
P. 102
CAT3525_C04.qxd 1/27/2005 11:12 AM Page 73
Characterization of Solid Waste 73
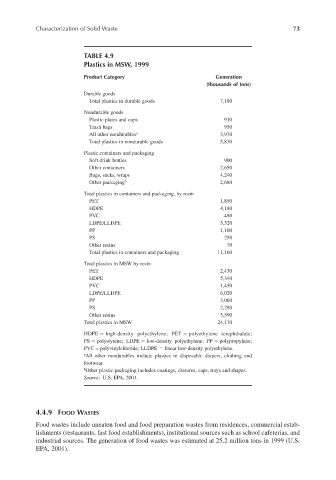
TABLE 4.9
Plastics in MSW, 1999
Product Category Generation
(thousands of tons)
Durable goods
Total plastics in durable goods 7,180
Nondurable goods
Plastic plates and cups 910
Trash bags 950
All other nondurables a 3,970
Total plastics in nondurable goods 5,830
Plastic containers and packaging
Soft drink bottles 900
Other containers 2,650
Bags, sacks, wraps 4,240
Other packaging b 2,680
Total plastics in containers and packaging, by resin
PET 1,850
HDPE 4,180
PVC 480
LDPE/LLDPE 3,320
PP 1,100
PS 250
Other resins 70
Total plastics in containers and packaging 11,160
Total plastics in MSW by resin
PET 2,430
HDPE 5,340
PVC 1,450
LDPE/LLDPE 6,020
PP 3,060
PS 2,280
Other resins 3,590
Total plastics in MSW 24,170
HDPE high-density polyethylene; PET polyethylene terephthalate;
PS polystyrene; LDPE low-density polyethylene; PP polypropylene;
PVC = polyvinylchloride; LLDPE linear low-density polyethylene.
a All other nondurables include plastics in disposable diapers, clothing and
footwear.
b Other plastic packaging includes coatings, closures, caps, trays and shapes.
Source: U.S. EPA, 2001.
4.4.9 FOOD WASTES
Food wastes include uneaten food and food preparation wastes from residences, commercial estab-
lishments (restaurants, fast food establishments), institutional sources such as school cafeterias, and
industrial sources. The generation of food wastes was estimated at 25.2 million tons in 1999 (U.S.
EPA, 2001).