
Page 97 - Materials Chemistry, Second Edition
P. 97
CAT3525_C04.qxd 1/27/2005 11:12 AM Page 68
68 Waste Management Practices: Municipal, Hazardous, and Industrial
1.4
Per capita generation (kg/day) 1.0
1.2
0.8
0.6
0.4
0.2
0
2 3 4 5 6 7 8 9 10
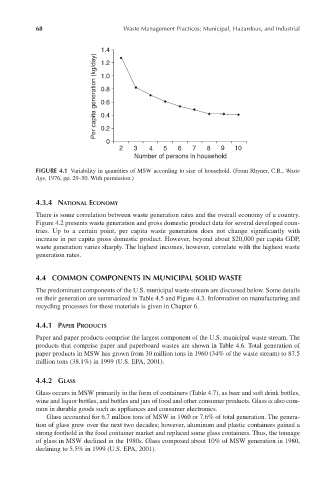
Number of persons in household
FIGURE 4.1 Variability in quantities of MSW according to size of household. (From Rhyner, C.R., Waste
Age, 1976, pp. 29–50. With permission.)
4.3.4 NATIONAL ECONOMY
There is some correlation between waste generation rates and the overall economy of a country.
Figure 4.2 presents waste generation and gross domestic product data for several developed coun-
tries. Up to a certain point, per capita waste generation does not change significantly with
increase in per capita gross domestic product. However, beyond about $20,000 per capita GDP,
waste generation varies sharply. The highest incomes, however, correlate with the highest waste
generation rates.
4.4 COMMON COMPONENTS IN MUNICIPAL SOLID WASTE
The predominant components of the U.S. municipal waste stream are discussed below. Some details
on their generation are summarized in Table 4.5 and Figure 4.3. Information on manufacturing and
recycling processes for these materials is given in Chapter 6.
4.4.1 PAPER PRODUCTS
Paper and paper products comprise the largest component of the U.S. municipal waste stream. The
products that comprise paper and paperboard wastes are shown in Table 4.6. Total generation of
paper products in MSW has grown from 30 million tons in 1960 (34% of the waste stream) to 87.5
million tons (38.1%) in 1999 (U.S. EPA, 2001).
4.4.2 GLASS
Glass occurs in MSW primarily in the form of containers (Table 4.7), as beer and soft drink bottles,
wine and liquor bottles, and bottles and jars of food and other consumer products. Glass is also com-
mon in durable goods such as appliances and consumer electronics.
Glass accounted for 6.7 million tons of MSW in 1960 or 7.6% of total generation. The genera-
tion of glass grew over the next two decades; however, aluminum and plastic containers gained a
strong foothold in the food container market and replaced some glass containers. Thus, the tonnage
of glass in MSW declined in the 1980s. Glass composed about 10% of MSW generation in 1980,
declining to 5.5% in 1999 (U.S. EPA, 2001).