
Page 95 - Materials Chemistry, Second Edition
P. 95
CAT3525_C04.qxd 1/27/2005 11:12 AM Page 66
66 Waste Management Practices: Municipal, Hazardous, and Industrial
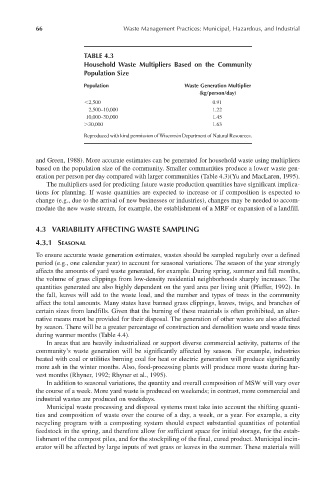
TABLE 4.3
Household Waste Multipliers Based on the Community
Population Size
Population Waste Generation Multiplier
(kg/person/day)
2,500 0.91
2,500–10,000 1.22
10,000–30,000 1.45
30,000 1.63
Reproduced with kind permission of Wisconsin Department of Natural Resources.
and Green, 1988). More accurate estimates can be generated for household waste using multipliers
based on the population size of the community. Smaller communities produce a lower waste gen-
eration per person per day compared with larger communities (Table 4.3)(Yu and MacLaren, 1995).
The multipliers used for predicting future waste production quantities have significant implica-
tions for planning. If waste quantities are expected to increase or if composition is expected to
change (e.g., due to the arrival of new businesses or industries), changes may be needed to accom-
modate the new waste stream, for example, the establishment of a MRF or expansion of a landfill.
4.3 VARIABILITY AFFECTING WASTE SAMPLING
4.3.1 SEASONAL
To ensure accurate waste generation estimates, wastes should be sampled regularly over a defined
period (e.g., one calendar year) to account for seasonal variations. The season of the year strongly
affects the amounts of yard waste generated, for example. During spring, summer and fall months,
the volume of grass clippings from low-density residential neighborhoods sharply increases. The
quantities generated are also highly dependent on the yard area per living unit (Pfeffer, 1992). In
the fall, leaves will add to the waste load, and the number and types of trees in the community
affect the total amounts. Many states have banned grass clippings, leaves, twigs, and branches of
certain sizes from landfills. Given that the burning of these materials is often prohibited, an alter-
native means must be provided for their disposal. The generation of other wastes are also affected
by season. There will be a greater percentage of construction and demolition waste and waste tires
during warmer months (Table 4.4).
In areas that are heavily industrialized or support diverse commercial activity, patterns of the
community’s waste generation will be significantly affected by season. For example, industries
heated with coal or utilities burning coal for heat or electric generation will produce significantly
more ash in the winter months. Also, food-processing plants will produce more waste during har-
vest months (Rhyner, 1992; Rhyner et al., 1995).
In addition to seasonal variations, the quantity and overall composition of MSW will vary over
the course of a week. More yard waste is produced on weekends; in contrast, more commercial and
industrial wastes are produced on weekdays.
Municipal waste processing and disposal systems must take into account the shifting quanti-
ties and composition of waste over the course of a day, a week, or a year. For example, a city
recycling program with a composting system should expect substantial quantities of potential
feedstock in the spring, and therefore allow for sufficient space for initial storage, for the estab-
lishment of the compost piles, and for the stockpiling of the final, cured product. Municipal incin-
erator will be affected by large inputs of wet grass or leaves in the summer. These materials will