
Page 98 - Materials Chemistry, Second Edition
P. 98
CAT3525_C04.qxd 1/27/2005 11:12 AM Page 69
Characterization of Solid Waste 69
5
4.5
USA
Australia
4 Finland Canada
MSW pounds/capita/day 2.5 3 2 Turkey Mexico Greece Spain Sweden Germany Norway Switzerland
3.5
Iceland
Netherlands
France
Denmark
Austria
Japan
Belgium
Hungary
Italy
Poland
Portugal
1.5
1
0.5
0
$5,000 $10,000 $15,000 $20,000 $25,000 $30,000 $35,000
GDP per capita
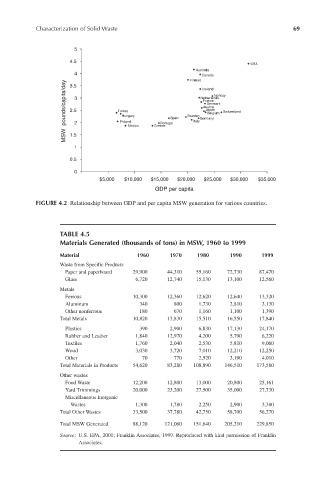
FIGURE 4.2 Relationship between GDP and per capita MSW generation for various countries.
TABLE 4.5
Materials Generated (thousands of tons) in MSW, 1960 to 1999
Material 1960 1970 1980 1990 1999
Waste from Specific Products
Paper and paperboard 29,900 44,310 55,160 72,730 87,470
Glass 6,720 12,740 15,130 13,100 12,560
Metals
Ferrous 10,300 12,360 12,620 12,640 13,320
Aluminum 340 800 1,730 2,810 3,130
Other nonferrous 180 670 1,160 1,100 1,390
Total Metals 10,820 13,830 15,510 16,550 17,840
Plastics 390 2,900 6,830 17,130 24,170
Rubber and Leather 1,840 12,970 4,200 5,790 6,220
Textiles 1,760 2,040 2,530 5,810 9,060
Wood 3,030 3,720 7,010 12,210 12,250
Other 70 770 2,520 3,190 4,010
Total Materials in Products 54,620 83,280 108,890 146,510 173,580
Other wastes
Food Waste 12,200 12,800 13,000 20,800 25,161
Yard Trimmings 20,000 23,200 27,500 35,000 27,730
Miscellaneous Inorganic
Wastes 1,300 1,780 2,250 2,900 3,380
Total Other Wastes 33,500 37,780 42,750 58,700 56,270
Total MSW Generated 88,120 121,060 151,640 205,210 229,850
Source: U.S. EPA, 2001; Franklin Associates, 1999. Reproduced with kind permission of Franklin
Associates.