
Page 96 - Materials Chemistry, Second Edition
P. 96
CAT3525_C04.qxd 1/27/2005 11:12 AM Page 67
Characterization of Solid Waste 67
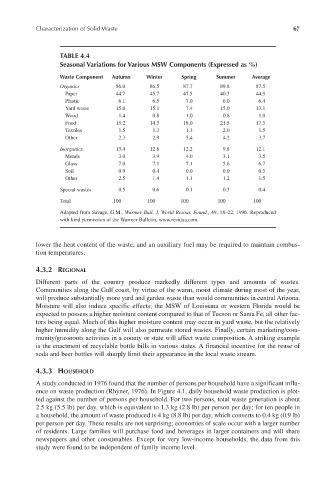
TABLE 4.4
Seasonal Variations for Various MSW Components (Expressed as %)
Waste Component Autumn Winter Spring Summer Average
Organics 86.0 86.5 87.7 89.8 87.5
Paper 44.7 45.7 47.5 40.3 44.5
Plastic 6.1 6.5 7.0 6.0 6.4
Yard waste 15.0 15.1 7.4 15.0 13.1
Wood 1.4 0.8 1.0 0.8 1.0
Food 15.2 14.3 18.0 21.5 17.3
Textiles 1.5 1.3 1.3 2.0 1.5
Other 2.3 2.9 5.4 4.2 3.7
Inorganics 13.4 12.8 12.2 9.8 12.1
Metals 3.0 3.9 4.0 3.1 3.5
Glass 7.0 7.1 7.1 5.6 6.7
Soil 0.9 0.4 0.0 0.0 0.3
Other 2.5 1.4 1.1 1.2 1.5
Special wastes 0.5 0.6 0.1 0.3 0.4
Total 100 100 100 100 100
Adapted from Savage, G.M., Warmer Bull. J. World Resour. Found., 49, 18–22, 1996. Reproduced
with kind permission of the Warmer Bulletin, www.residua.com.
lower the heat content of the waste, and an auxiliary fuel may be required to maintain combus-
tion temperatures.
4.3.2 REGIONAL
Different parts of the country produce markedly different types and amounts of wastes.
Communities along the Gulf coast, by virtue of the warm, moist climate during most of the year,
will produce substantially more yard and garden waste than would communities in central Arizona.
Moisture will also induce specific effects; the MSW of Louisiana or western Florida would be
expected to possess a higher moisture content compared to that of Tucson or Santa Fe, all other fac-
tors being equal. Much of this higher moisture content may occur in yard waste, but the relatively
higher humidity along the Gulf will also permeate stored wastes. Finally, certain marketing/com-
munity/grassroots activities in a county or state will affect waste composition. A striking example
is the enactment of recyclable bottle bills in various states. A financial incentive for the reuse of
soda and beer bottles will sharply limit their appearance in the local waste stream.
4.3.3 HOUSEHOLD
A study conducted in 1976 found that the number of persons per household have a significant influ-
ence on waste production (Rhyner, 1976). In Figure 4.1, daily household waste production is plot-
ted against the number of persons per household. For two persons, total waste generation is about
2.5 kg (5.5 lb) per day, which is equivalent to 1.3 kg (2.8 lb) per person per day; for ten people in
a household, the amount of waste produced is 4 kg (8.8 lb) per day, which converts to 0.4 kg (0.9 lb)
per person per day. These results are not surprising; economies of scale occur with a larger number
of residents. Large families will purchase food and beverages in larger containers and will share
newspapers and other consumables. Except for very low-income households, the data from this
study were found to be independent of family income level.