Page 169 - Water Engineering Hydraulics, Distribution and Treatment
P. 169

From Appendix 25, K = 0.37.
                                                         c
                                         From Table 5.2, K = 0.37.
                                         From Appendix 17, equivalent length of 6 in. pipe = 5.5 ft = 1.676 m.
                                                                            Q = A v = Q = A v .
                                                                             1
                                                                                       2
                                                                                 1 1
                                                                                     2
                                                                   0.01416 = (  ∕4)(0.3048) v = (  ∕4)(0.1504) v .
                                                                                       1
                                                                               v = 0.194 m∕s.
                                                                                1
                                                                               v = 0.797 m∕s.
                                                                                2
                                                                                     (v ) 2  2 2    2  2          5.2 Fluid Transport  147
                                                                                       2
                                                                                h = K    .
                                                                                 f
                                                                                      2g
                                                                              2
                                                                  h = 0.37(0.797) ∕(2 × 9.80) = 0.012 m = 12 mm.
                                                                   f
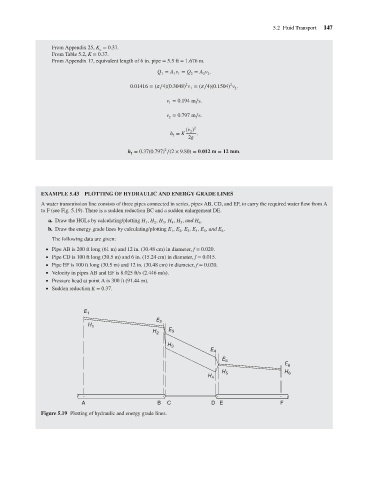
                                      EXAMPLE 5.43 PLOTTING OF HYDRAULIC AND ENERGY GRADE LINES
                                      A water transmission line consists of three pipes connected in series, pipes AB, CD, and EF, to carry the required water flow from A
                                      to F (see Fig. 5.19). There is a sudden reduction BC and a sudden enlargement DE.
                                        a. Draw the HGLs by calculating/plotting H , H , H , H , H , and H .
                                                                        1  2  3  4  5     6
                                        b. Draw the energy grade lines by calculating/plotting E , E ,E ,E ,E , and E .
                                                                                      3
                                                                                         4
                                                                                                 6
                                                                                   2
                                                                                 1
                                                                                           5
                                         The following data are given:
                                         Pipe AB is 200 ft long (61 m) and 12 in. (30.48 cm) in diameter, f = 0.020.

                                         Pipe CD is 100 ft long (30.5 m) and 6 in. (15.24 cm) in diameter, f = 0.015.

                                         Pipe EF is 100 ft long (30.5 m) and 12 in. (30.48 cm) in diameter, f = 0.020.

                                           Velocity in pipes AB and EF is 8.025 ft/s (2.446 m/s).
                                           Pressure head at point A is 300 ft (91.44 m).
                                           Sudden reduction K = 0.37.
                                                    E 1
                                                                            E 2
                                                     H 1
                                                                           H 2  E 3
                                                                               H 3
                                                                                              E 4
                                                                                                 E
                                                                                                   5
                                                                                                                      E 6
                                                                                                 H 5                  H 6
                                                                                             H 4
                                                   A                        B  C              D E                    F
                                      Figure 5.19 Plotting of hydraulic and energy grade lines.
   164   165   166   167   168   169   170   171   172   173   174