Page 261 - Water Engineering Hydraulics, Distribution and Treatment
P. 261

239
                                                                                                                  Problems/Questions
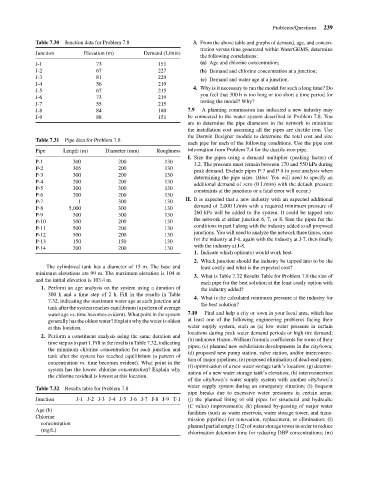
                                              Junction data for Problem 7.8
                                                                                        3. From the above table and graphs of demand, age, and concen-
                                    Table 7.30
                                                                                          tration versus time generated within WaterGEMS, determine
                                    Junction
                                                                        Demand (L/min)
                                                    Elevation (m)
                                                                                          the following correlations:
                                                                                          (a) Age and chlorine concentration;
                                                                            151
                                                        73
                                    J-1
                                    J-2
                                                                            227
                                                        67
                                                                                          (b) Demand and chlorine concentration at a junction;
                                    J-3
                                                        81
                                                                            229
                                                                                          (c) Demand and water age at a junction.
                                    J-4
                                                                            219
                                                        56
                                                                                        4. Why is it necessary to run the model for such a long time? Do
                                                        67
                                    J-5
                                                                            215
                                                                                          you feel that 300 h is too long or too short a time period for
                                                        73
                                    J-6
                                                                            219
                                                                                          testing the model? Why?
                                    J-7
                                                        55
                                                                            215
                                                                                           A planning commission has indicated a new industry may
                                                                                      7.9
                                                                            180
                                                        84
                                    J-8
                                                                                      be connected to the water system described in Problem 7.8. You
                                                        88
                                    J-9
                                                                            151
                                                                                      are to determine the pipe diameters in the network to minimize
                                                                                      the installation cost assuming all the pipes are ductile iron. Use
                                                                                      the Darwin Designer module to determine the total cost and size
                                    Table 7.31  Pipe data for Problem 7.8
                                                                                      each pipe for each of the following conditions. Use the pipe cost
                                    Pipe     Length (m)    Diameter (mm)    Roughness  information from Problem 7.4 for the ductile-iron pipe.
                                                                                      I. Size the pipes using a demand multiplier (peaking factor) of
                                    P-1         300            200            130
                                                                                        3.2. The pressure must remain between 170 and 550 kPa during
                                    P-2         305            200            130
                                                                                        peak demand. Exclude pipes P-7 and P-8 in your analysis when
                                    P-3         300            200            130
                                                                                        determining the pipe sizes. (Hint: You will need to specify an
                                    P-4         200            200            130
                                                                                        additional demand of zero (0 L/min) with the default pressure
                                    P-5         300            300            130
                                                                                        constraints at the junctions or a fatal error will occur.)
                                    P-6         200            200            130
                                                                                     II. It is expected that a new industry with an expected additional
                                    P-7           1            300            130
                                                                                        demand of 2,000 L/min with a required minimum pressure of
                                    P-8        5,000           300            130
                                                                                        260 kPa will be added to the system. It could be tapped into
                                    P-9         300            300            130
                                                                                        the network at either junction 6, 7, or 8. Size the pipes for the
                                    P-10        500            200            130
                                                                                        conditions in part I along with the industry added to all proposed
                                    P-11        500            200            130
                                                                                        junctions. You will need to analyze the network three times, once
                                    P-12        500            200            130
                                                                                        for the industry at J-6, again with the industry at J-7, then finally
                                    P-13        150            150            130
                                                                                        with the industry at J-8.
                                    P-14        200            200            130
                                                                                        1. Indicate which option(s) would work best.
                                                                                        2. Which junction should the industry be tapped into to be the
                                       The cylindrical tank has a diameter of 15 m. The base and  least costly and what is the expected cost?
                                    minimum elevations are 99 m. The maximum elevation is 104 m
                                                                                        3. What is Table 7.32 Results Table for Problem 7.8 the size of
                                    and the initial elevation is 103.4 m.
                                                                                          each pipe for the best solution at the least costly option with
                                      1. Perform an age analysis on the system using a duration of  the industry added?
                                        300 h and a time step of 2 h. Fill in the results in Table
                                                                                        4. What is the calculated minimum pressure at the industry for
                                        7.32, indicating the maximum water age at each junction and
                                                                                          the best solution?
                                        tank after the system reaches equilibrium (a pattern of average
                                        water age vs. time becomes evident). What point in the system  7.10  Find and help a city or town in your local area, which has
                                        generally has the oldest water? Explain why the water is oldest  at least one of the following engineering problems facing their
                                        at this location.                             water supply system, such as (a) low water pressure in certain
                                                                                      locations during peak water demand periods or high fire demand;
                                      2. Perform a constituent analysis using the same duration and
                                                                                      (b) unknown Hazen–William formula coefficients for some of their
                                        time step as in part 1. Fill in the results in Table 7.32, indicating
                                                                                      pipes; (c) planned new subdivision developments in the city/town;
                                        the minimum chlorine concentration for each junction and
                                                                                      (d) proposed new pump station, valve station, and/or interconnec-
                                        tank after the system has reached equilibrium (a pattern of
                                                                                      tion of major pipelines; (e) proposed elimination of dead-end pipes;
                                        concentration vs. time becomes evident). What point in the  (f) optimization of a new water storage tank’s location; (g) determi-
                                        system has the lowest chlorine concentration? Explain why  nation of a new water storage tank’s elevation; (h) interconnection
                                        the chlorine residual is lowest at this location.
                                                                                      of the city/town’s water supply system with another city/town’s
                                                                                      water supply system during an emergency situation; (i) frequent
                                    Table 7.32  Results table for Problem 7.8
                                                                                      pipe breaks due to excessive water pressures in certain areas;
                                    Junction     J-1 J-2 J-3 J-4 J-5 J-6 J-7 J-8 J-9 T-1  (j) the planned lining of old pipes for structural and hydraulic
                                                                                      (C value) improvements; (k) planned by-passing of major water
                                    Age (h)                                           facilities (such as water reservoir, water storage tower, and trans-
                                    Chlorine                                          mission pipeline) for renovation, replacement, or elimination; (l)
                                      concentration                                   planned partial empty (1/2) of water storage tower in order to reduce
                                      (mg/L)
                                                                                      chlorination detention time for reducing DBP concentrations; (m)
   256   257   258   259   260   261   262   263   264   265   266