
Page 260 - Water Engineering Hydraulics, Distribution and Treatment
P. 260
238
Water Distribution Systems: Modeling and Computer Applications
Chapter 7
two water mains, one in Town Highway #64 and the other in Elm
7.8
Street. The following data were obtained:
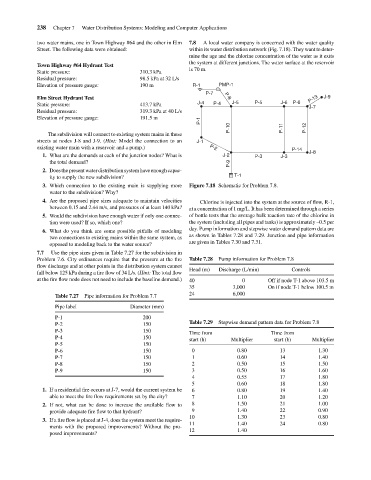
within its water distribution network (Fig. 7.18). They want to deter-
mine the age and the chlorine concentration of the water as it exits
the system at different junctions. The water surface at the reservoir
Town Highway #64 Hydrant Test
is 70 m.
Static pressure:
310.3 kPa
Residual pressure:
98.5 kPa at 32 L/s
R-1
Elevation of pressure gauge:
190 m
PMP-1
P-7
P-13
J-9
Elm Street Hydrant Test
P-8
J-5
P-5
J-6
P-6
P-4
413.7 kPa
Static pressure:
J-7
Residual pressure:
319.3 kPa at 40 L/s
191.5 m
Elevation of pressure gauge:
P-1 J-4 A local water company is concerned with the water quality
P-10 P-11 P-12
The subdivision will connect to existing system mains in these
streets at nodes J-8 and J-9. (Hint: Model the connection to an J-1
existing water main with a reservoir and a pump.) P-2 P-14
J-8
1. What are the demands at each of the junction nodes? What is J-2 P-3 J-3
the total demand? P-9
2. Does the present water distribution system have enough capac-
ity to supply the new subdivision? T-1
3. Which connection to the existing main is supplying more Figure 7.18 Schematic for Problem 7.8.
water to the subdivision? Why?
4. Are the proposed pipe sizes adequate to maintain velocities Chlorine is injected into the system at the source of flow, R-1,
between 0.15 and 2.44 m/s, and pressures of at least 140 kPa? at a concentration of 1 mg/L. It has been determined through a series
5. Would the subdivision have enough water if only one connec- of bottle tests that the average bulk reaction rate of the chlorine in
tion were used? If so, which one? the system (including all pipes and tanks) is approximately –0.5 per
6. What do you think are some possible pitfalls of modeling day. Pump information and stepwise water demand pattern data are
two connections to existing mains within the same system, as as shown in Tables 7.28 and 7.29. Junction and pipe information
opposed to modeling back to the water source? are given in Tables 7.30 and 7.31.
7.7 Use the pipe sizes given in Table 7.27 for the subdivision in
Problem 7.6. City ordinances require that the pressure at the fire Table 7.28 Pump information for Problem 7.8
flow discharge and at other points in the distribution system cannot
Head (m) Discharge (L/min) Controls
fall below 125 kPa during a fire flow of 34 L/s. (Hint: The total flow
at the fire flow node does not need to include the baseline demand.) 40 0 Off if node T-1 above 103.5 m
35 3,000 On if node T-1 below 100.5 m
Table 7.27 Pipe information for Problem 7.7 24 6,000
Pipe label Diameter (mm)
P-1 200
P-2 150 Table 7.29 Stepwise demand pattern data for Problem 7.8
P-3 150
Time from Time from
P-4 150
start (h) Multiplier start (h) Multiplier
P-5 150
P-6 150 0 0.80 13 1.30
P-7 150 1 0.60 14 1.40
P-8 150 2 0.50 15 1.50
P-9 150 3 0.50 16 1.60
4 0.55 17 1.80
5 0.60 18 1.80
1. If a residential fire occurs at J-7, would the current system be 6 0.80 19 1.40
able to meet the fire flow requirements set by the city? 7 1.10 20 1.20
2. If not, what can be done to increase the available flow to 8 1.50 21 1.00
provide adequate fire flow to that hydrant? 9 1.40 22 0.90
10 1.30 23 0.80
3. If a fire flow is placed at J-4, does the system meet the require-
11 1.40 24 0.80
ments with the proposed improvements? Without the pro-
12 1.40
posed improvements?