
Page 76 - Water Engineering Hydraulics, Distribution and Treatment
P. 76
54
Chapter 3
Values of u for type curve
−2
−3
10
−3
−2
−1
−3
−2
2 × 10
4 × 10
2 × 10
4 × 10
9
8
7
Observed points
6
5
4
Observed values of s W(u) 10 9 8 7 7 6 5 4 3 10 −3 Water Sources: Groundwater 6 × 10 8 × 10 −3 10 −2 Matching point Type curve 6 × 10 8 × 10 −2 −1 2 × 10 10 Values of W (u) for type curve
3
Transparent paper used
2
for plotting observed
Type curve
2
points by type curve
Observed
points Log W (u) and log p points and shifted to fit
Log C Log C
1 2
2
Log u and log (x /t) s
1
7
6
6 × 10 5 10 6 2 × 10 6 4 × 10 6 × 10 6 10 7 2 × 10 7 4 × 10 6 × 10 7 10 8
8 × 10 5 8 × 10 6 8 × 10 7
2
Observed values of r /t
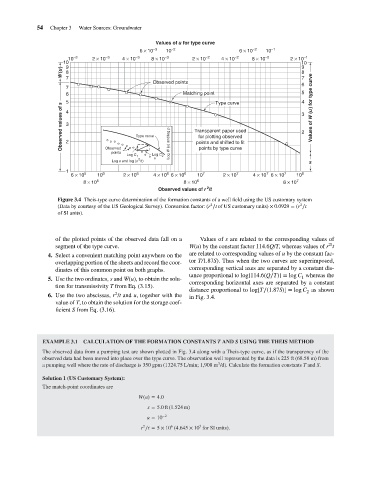
Figure 3.4 Theis-type curve determination of the formation constants of a well field using the US customary system
2
2
(Data by courtesy of the US Geological Survey). Conversion factor: (r ∕t of US customary units) × 0.0929 = (r ∕t
of SI units).
of the plotted points of the observed data fall on a Values of s are related to the corresponding values of
2/
segment of the type curve. W(u) by the constant factor 114.6Q/T, whereas values of r t
4. Select a convenient matching point anywhere on the are related to corresponding values of u by the constant fac-
overlapping portion of the sheets and record the coor- tor T/1.87S). Thus when the two curves are superimposed,
dinates of this common point on both graphs. corresponding vertical axes are separated by a constant dis-
tance proportional to log[114.6(Q∕T)] =log C whereas the
1
5. Use the two ordinates, s and W(u), to obtain the solu-
corresponding horizontal axes are separated by a constant
tion for transmissivity T from Eq. (3.15).
distance proportional to log[T∕(1.87S)] =log C as shown
2
2
6. Use the two abscissas, r /t and u, together with the in Fig. 3.4.
value of T, to obtain the solution for the storage coef-
ficient S from Eq. (3.16).
EXAMPLE 3.1 CALCULATION OF THE FORMATION CONSTANTS T AND S USING THE THEIS METHOD
The observed data from a pumping test are shown plotted in Fig. 3.4 along with a Theis-type curve, as if the transparency of the
observed data had been moved into place over the type curve. The observation well represented by the data is 225 ft (68.58 m) from
3
a pumping well where the rate of discharge is 350 gpm (1324.75 L/min; 1,908 m /d). Calculate the formation constants T and S.
Solution 1 (US Customary System):
The match-point coordinates are
W(u) = 4.0
s = 5.0ft(1.524 m)
u = 10 −2
2 6 5
r ∕t = 5 × 10 (4.645 × 10 for SI units).