Page 80 - Water Engineering Hydraulics, Distribution and Treatment
P. 80

58
                                         Chapter 3
                                      Discharge
                                                                     Time
                                       t = 0    t  Q Water Sources: Groundwater
                                                                            s´
                                      s and s´                        s

                                                                           s–s´

                                        Pump started
                                                   Pump stopped

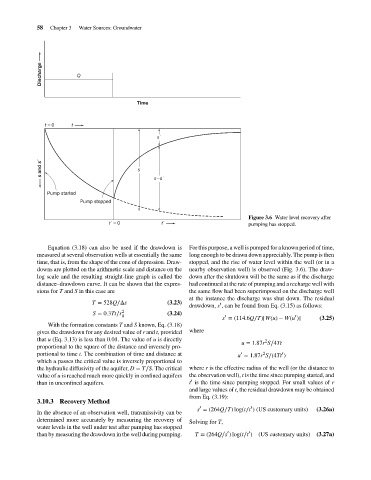
                                                                                                          Figure 3.6 Water level recovery after
                                                            t´ = 0           t´                           pumping has stopped.


                                        Equation (3.18) can also be used if the drawdown is  For this purpose, a well is pumped for a known period of time,
                                    measured at several observation wells at essentially the same  long enough to be drawn down appreciably. The pump is then
                                    time, that is, from the shape of the cone of depression. Draw-  stopped, and the rise of water level within the well (or in a
                                    downs are plotted on the arithmetic scale and distance on the  nearby observation well) is observed (Fig. 3.6). The draw-
                                    log scale and the resulting straight-line graph is called the  down after the shutdown will be the same as if the discharge
                                    distance–drawdown curve. It can be shown that the expres-  had continued at the rate of pumping and a recharge well with
                                    sions for T and S in this case are                 the same flow had been superimposed on the discharge well
                                                                                       at the instance the discharge was shut down. The residual
                                                       T = 528Q∕Δs             (3.23)            ′
                                                                                       drawdown, s , can be found from Eq. (3.15) as follows:
                                                       S = 0.3Tt∕r 2           (3.24)
                                                                0                                 ′                      ′
                                                                                                  s = (114.6Q∕T)[W(u) − W(u )]    (3.25)
                                        With the formation constants T and S known, Eq. (3.18)
                                    gives the drawdown for any desired value of r and t, provided  where
                                    that u (Eq. 3.13) is less than 0.01. The value of u is directly             2
                                                                                                        u = 1.87r S∕4Tt
                                    proportional to the square of the distance and inversely pro-
                                    portional to time t. The combination of time and distance at       u = 1.87r S∕(4Tt )
                                                                                                                     ′
                                                                                                               2
                                                                                                        ′
                                    which u passes the critical value is inversely proportional to
                                    the hydraulic diffusivity of the aquifer, D = T∕S. The critical  where r is the effective radius of the well (or the distance to
                                    value of u is reached much more quickly in confined aquifers  the observation well), t is the time since pumping started, and
                                                                                       ′
                                    than in unconfined aquifers.                       t is the time since pumping stopped. For small values of r
                                                                                       and large values of t, the residual drawdown may be obtained
                                                                                       from Eq. (3.19):
                                    3.10.3 Recovery Method
                                                                                                           ′
                                                                                          ′
                                                                                         s = (264Q∕T) log(t∕t ) (US customary units)  (3.26a)
                                    In the absence of an observation well, transmissivity can be
                                    determined more accurately by measuring the recovery of  Solving for T,
                                    water levels in the well under test after pumping has stopped
                                                                                                   ′
                                                                                                          ′
                                    than by measuring the drawdown in the well during pumping.  T = (264Q∕s ) log(t∕t ) (US customary units)  (3.27a)
   75   76   77   78   79   80   81   82   83   84   85