Page 83 - Water Engineering Hydraulics, Distribution and Treatment
P. 83

This is independent of Q and depends only on the diffusivity of the aquifer. The change in drawdown per log cycle from Eq. (3.23) is
                                                                           Δs = 528 Q∕T
                                                                For 150 gpm: Δs = 528 × 150∕1 × 10 = 7.9ft(2.4m)
                                                                            1
                                                                For 200 gpm: Δs = 10.6ft(3.23 m)
                                                                            2
                                                                For 250 gpm: Δs = 13.2ft(4.02 m).
                                                                            3
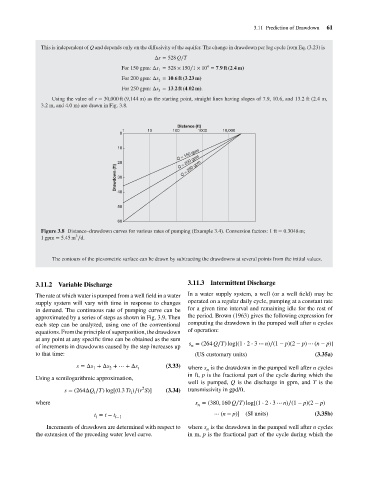
                                         Using the value of r = 30,000 ft (9,144 m) as the starting point, straight lines having slopes of 7.9, 10.6, and 13.2 ft (2.4 m,
                                      3.2 m, and 4.0 m) are drawn in Fig. 3.8.
                                                                                   Distance (ft)  4         3.11 Prediction of Drawdown  61
                                                                1        10      100     1000     10,000
                                                                0
                                                               10
                                                                                   Q = 150 gpm
                                                                                    Q = 250 gpm
                                                               20                  Q = 200 gpm
                                                              Drawdown (ft)  30
                                                               40
                                                               50
                                                               60
                                      Figure 3.8 Distance–drawdown curves for various rates of pumping (Example 3.4). Conversion factors: 1 ft = 0.3048 m;
                                                 3
                                      1 gpm = 5.45 m ∕d.


                                         The contours of the piezometric surface can be drawn by subtracting the drawdowns at several points from the initial values.


                                    3.11.2 Variable Discharge                         3.11.3 Intermittent Discharge

                                    The rate at which water is pumped from a well field in a water  In a water supply system, a well (or a well field) may be
                                    supply system will vary with time in response to changes  operated on a regular daily cycle, pumping at a constant rate
                                    in demand. The continuous rate of pumping curve can be  for a given time interval and remaining idle for the rest of
                                    approximated by a series of steps as shown in Fig. 3.9. Then  the period. Brown (1963) gives the following expression for
                                    each step can be analyzed, using one of the conventional  computing the drawdown in the pumped well after n cycles
                                    equations. From the principle of superposition, the drawdown  of operation:
                                    at any point at any specific time can be obtained as the sum
                                                                                      s = (264 Q∕T) log[(1 ⋅ 2 ⋅ 3 ⋯ n)∕(1 − p)(2 − p) ⋯ (n − p)]
                                    of increments in drawdowns caused by the step increases up  n
                                    to that time:                                       (US customary units)                    (3.35a)

                                                 s =Δs +Δs + ⋯ +Δs             (3.33)
                                                       1    2         t               where s is the drawdown in the pumped well after n cycles
                                                                                            n
                                                                                      in ft, p is the fractional part of the cycle during which the
                                    Using a semilogarithmic approximation,
                                                                                      well is pumped, Q is the discharge in gpm, and T is the
                                                                       2
                                             s = (264ΔQ ∕T) log[(0.3 Tt )∕(r S)]  (3.34)  transmissivity in gpd/ft.
                                                       i
                                                                   i
                                    where                                                s = (380, 160 Q∕T) log[(1 ⋅ 2 ⋅ 3 ⋯ n)∕(1 − p)(2 − p)
                                                                                         n
                                                       t = t − t i−1                           ⋯ (n − p)]  (SI units)           (3.35b)
                                                        i
                                       Increments of drawdown are determined with respect to  where s is the drawdown in the pumped well after n cycles
                                                                                            n
                                    the extension of the preceding water level curve.  in m, p is the fractional part of the cycle during which the
   78   79   80   81   82   83   84   85   86   87   88