
Page 103 - Water Loss Control
P. 103
Evaluating W ater Losses 85
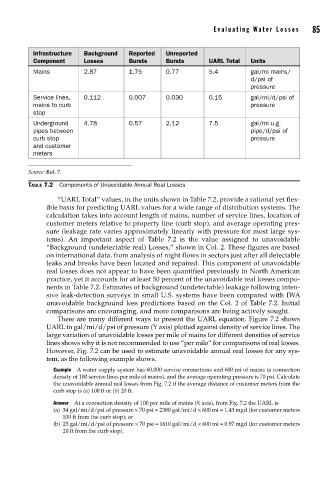
Infrastructure Background Reported Unreported
Component Losses Bursts Bursts UARL Total Units
Mains 2.87 1.75 0.77 5.4 gal/mi mains/
d/psi of
pressure
Service lines, 0.112 0.007 0.030 0.15 gal/mi/d/psi of
mains to curb pressure
stop
Underground 4.78 0.57 2.12 7.5 gal/mi u.g.
pipes between pipe/d/psi of
curb stop pressure
and customer
meters
Source: Ref. 7.
TABLE 7.2 Components of Unavoidable Annual Real Losses
“UARL Total” values, in the units shown in Table 7.2, provide a rational yet flex-
ible basis for predicting UARL values for a wide range of distribution systems. The
calculation takes into account length of mains, number of service lines, location of
customer meters relative to property line (curb stop), and average operating pres-
sure (leakage rate varies approximately linearly with pressure for most large sys-
tems). An important aspect of Table 7.2 is the value assigned to unavoidable
“Background (undetectable real) Losses,” shown in Col. 2. These figures are based
on international data, from analysis of night flows in sectors just after all detectable
leaks and breaks have been located and repaired. This component of unavoidable
real losses does not appear to have been quantified previously in North American
practice, yet it accounts for at least 50 percent of the unavoidable real losses compo-
nents in Table 7.2. Estimates of background (undetectable) leakage following inten-
sive leak-detection surveys in small U.S. systems have been compared with IWA
unavoidable background loss predictions based on the Col. 2 of Table 7.2. Initial
comparisons are encouraging, and more comparisons are being actively sought.
There are many different ways to present the UARL equation. Figure 7.2 shows
UARL in gal/mi/d/psi of pressure (Y axis) plotted against density of service lines. The
large variation of unavoidable losses per mile of mains for different densities of service
lines shows why it is not recommended to use “per mile” for comparisons of real losses.
However, Fig. 7.2 can be used to estimate unavoidable annual real losses for any sys-
tem, as the following example shows.
Example A water supply system has 60,000 service connections and 600 mi of mains (a connection
density of 100 service lines per mile of mains), and the average operating pressure is 70 psi. Calculate
the unavoidable annual real losses from Fig. 7.2 if the average distance of customer meters from the
curb stop is (a) 100 ft or (b) 20 ft.
Answer At a connection density of 100 per mile of mains (X axis), from Fig. 7.2 the UARL is
(a) 34 gal/mi/d/psi of pressure × 70 psi = 2380 gal/mi/d × 600 mi = 1.43 mgd (for customer meters
100 ft from the curb stop); or
(b) 23 gal/mi/d/psi of pressure × 70 psi = 1610 gal/mi/d × 600 mi = 0.97 mgd (for customer meters
20 ft from the curb stop).