
Page 106 - Water Loss Control
P. 106
88 Cha pte r Se v e n
Because per capita consumption in North America is so high compared to most
other countries, the common practice of expressing water losses as a percent of sys-
tem input volume tends to produce lower figures than would be the case in the other
countries. This gives a false impression of true performance when comparisons of
performance are made with other countries with lower per capita consumption.
The same problem occurs when comparisons are made between North American utili-
ties with a high consumption base and North American utilities with a low consumption
base. Data of 1996 showed that 51 water supply systems in California had density of con-
nections varying from 24 to 155 per mile, with an average of 75 per mile. The average
metered consumption per connection varied from 136 to 2200 gal/service conn/d, with an
average of some 600 gal/service conn/d. Suppose that each of these water utilities was
achieving real losses of 60 gal/service conn/d, which is around three times the unavoidable
annual real losses (21 gal/service conn/d) for a system with 75 conn/mi, pressure of
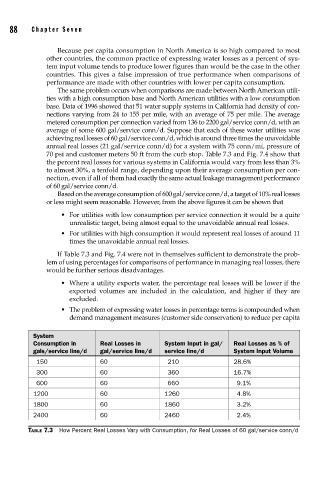
70 psi and customer meters 50 ft from the curb stop. Table 7.3 and Fig. 7.4 show that
the percent real losses for various systems in California would vary from less than 3%
to almost 30%, a tenfold range, depending upon their average consumption per con-
nection, even if all of them had exactly the same actual leakage management performance
of 60 gal/service conn/d.
Based on the average consumption of 600 gal/service conn/d, a target of 10% real losses
or less might seem reasonable. However, from the above figures it can be shown that
• For utilities with low consumption per service connection it would be a quite
unrealistic target, being almost equal to the unavoidable annual real losses.
• For utilities with high consumption it would represent real losses of around 11
times the unavoidable annual real losses.
If Table 7.3 and Fig. 7.4 were not in themselves sufficient to demonstrate the prob-
lem of using percentages for comparisons of performance in managing real losses, there
would be further serious disadvantages.
• Where a utility exports water, the percentage real losses will be lower if the
exported volumes are included in the calculation, and higher if they are
excluded.
• The problem of expressing water losses in percentage terms is compounded when
demand management measures (customer side conservation) to reduce per capita
System
Consumption in Real Losses in System Input in gal/ Real Losses as % of
gals/service line/d gal/service line/d service line/d System Input Volume
150 60 210 28.6%
300 60 360 16.7%
600 60 660 9.1%
1200 60 1260 4.8%
1800 60 1860 3.2%
2400 60 2460 2.4%
TABLE 7.3 How Percent Real Losses Vary with Consumption, for Real Losses of 60 gal/service conn/d