
Page 107 - Water Loss Control
P. 107
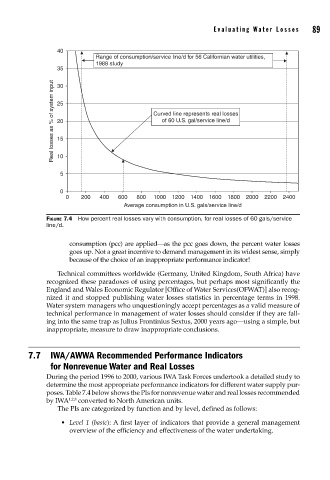
Evaluating W ater Losses    89


                       40
                                  Range of consumption/service line/d for 56 Californian water utilities,
                                  1988 study
                       35
                      Real losses as % of system input  25  Curved line represents real losses
                       30


                                                     of 60 U.S. gal/service line/d
                       20
                       15

                       10

                        5


                        0
                          0   200  400   600  800  1000  1200  1400  1600  1800  2000  2200  2400
                                          Average consumption in U.S. gals/service line/d
                    FIGURE 7.4  How percent real losses vary with consumption, for real losses of 60 gals/service
                    line/d.

                           consumption (pcc) are applied—as the pcc goes down, the percent water losses
                           goes up. Not a great incentive to demand management in its widest sense, simply
                           because of the choice of an inappropriate performance indicator!
                       Technical committees worldwide (Germany, United Kingdom, South Africa) have
                    recognized these paradoxes of using percentages, but perhaps most significantly the
                    England and Wales Economic Regulator [Office of Water Services(OFWAT)] also recog-
                    nized it and stopped publishing water losses statistics in percentage terms in 1998.
                    Water system managers who unquestioningly accept percentages as a valid measure of
                    technical performance in management of water losses should consider if they are fall-
                    ing into the same trap as Julius Frontinius Sextus, 2000 years ago—using a simple, but
                    inappropriate, measure to draw inappropriate conclusions.


               7.7   IWA/AWWA Recommended Performance Indicators
                     for Nonrevenue Water and Real Losses
                    During the period 1996 to 2000, various IWA Task Forces undertook a detailed study to
                    determine the most appropriate performance indicators for different water supply pur-
                    poses. Table 7.4 below shows the PIs for nonrevenue water and real losses recommended
                    by IWA 1,2,8  converted to North American units.
                       The PIs are categorized by function and by level, defined as follows:

                        •  Level 1 (basic): A first layer of indicators that provide a general management
                           overview of the efficiency and effectiveness of the water undertaking.