Page 104 - Water Loss Control
P. 104

86    Cha pte r  Se v e n


                       60

                       50
                      UARL (gal/mi of mains/d/psi)  40                         Meter 100 ft after
                                                                                 curb stop

                       30

                       20
                                                                                Service lines,
                                                                               main to curb stop
                       10
                                                                                   Mains
                        0
                         0     20     40    60     80    100    120   140    160   180    200
                                         Density of service lines (service lines/mi of mains)
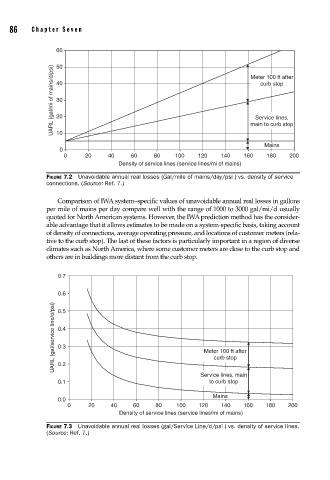
                    FIGURE 7.2  Unavoidable annual real losses (Gal/mile of mains/day/psi ) vs. density of service
                    connections. (Source: Ref. 7.)

                       Comparison of IWA system–specific values of unavoidable annual real losses in gallons
                    per mile of mains per day compare well with the range of 1000 to 3000 gal/mi/d usually
                    quoted for North American systems. However, the IWA prediction method has the consider-
                    able advantage that it allows estimates to be made on a system-specific basis, taking account
                    of density of connections, average operating pressure, and locations of customer meters (rela-
                    tive to the curb stop). The last of these factors is particularly important in a region of diverse
                    climates such as North America, where some customer meters are close to the curb stop and
                    others are in buildings more distant from the curb stop.


                        0.7

                        0.6
                      UARL (gal/service line/d/psi)  0.4         Meter 100 ft after
                        0.5


                        0.3
                                                                    curb stop
                        0.2
                                                                Service lines, main
                        0.1                                        to curb stop
                                                                    Mains
                        0.0
                          0     20     40    60    80    100    120   140    160   180   200
                                         Density of service lines (service lines/mi of mains)

                    FIGURE 7.3  Unavoidable annual real losses (gal/Service Line/d/psi ) vs. density of service lines.
                    (Source: Ref. 7.)
   99   100   101   102   103   104   105   106   107   108   109