
Page 221 - Water Loss Control
P. 221
194 Cha pte r T w e l v e
METER EFFICIENCY TEST WORKSHEET
Date of Test___________________________ Name of Account______________________
Location of Meter______________________ Meter Data: Size______________________
Type_____________________
Manufacturer_________________
Serial No.__________________
Date of Last Test______________
Test Data:
Volume recorded on meter*÷ Volume recorded on tester = Efficiency Rating
Low Flow @__________ G.P.M._____ ________ ÷ ___________________ = ____________________
†
†
Mid Flow @___ _______ G.P.M._____ ________ ÷ ___________________ = ____________________
†
High Flow @__________ G.P.M._____ ________ ÷ ___________________ = ____________________
Total of 3 efficiency ratings
÷ 3 =
* If conversion from cubit feet Average Efficiency Rating:
to gallons is required, multiply
cubic feet by 7.48
†
Use flow rate recommended
for meter size
Repeat Avg. Rating
Revenue Computation
Meter Efficiency Computation $ Amount charged customer
for recent 12-month period Potential Revenue
1. Test meter at high, medium, and
low flow rates recommended for
meter size. ÷ =
2. For each test, divide reading on
meter by reading on tester and
record the 3 meter efficiency
ratings. –
3. Total the 3 ratings and divide by Repeat amount charged
3 to get average efficiency
rating.
4. Divide $ amount charged from
customer for recent 12-month
period by average efficiency Lost Revenue $
rate to get pot ential revenue.
5. Subtract $ amount charged from
potential revenue to get revenue
lost.
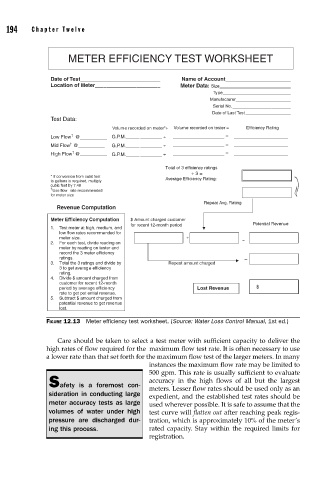
FIGURE 12.13 Meter effi ciency test worksheet. (Source: Water Loss Control Manual, 1st ed.)
Care should be taken to select a test meter with sufficient capacity to deliver the
high rates of flow required for the maximum flow test rate. It is often necessary to use
a lower rate than that set forth for the maximum flow test of the larger meters. In many
instances the maximum flow rate may be limited to
500 gpm. This rate is usually sufficient to evaluate
accuracy in the high flows of all but the largest
Safety is a foremost con-
meters. Lesser flow rates should be used only as an
sideration in conducting large
expedient, and the established test rates should be
meter accuracy tests as large used wherever possible. It is safe to assume that the
volumes of water under high test curve will flatten out after reaching peak regis-
pressure are discharged dur- tration, which is approximately 10% of the meter’s
ing this process. rated capacity. Stay within the required limits for
registration.