
Page 128 - Water and wastewater engineering
P. 128
INTAKE STRUCTURES 3-25
20
19
Maximum
total head
Total dynamic head, m 17 Minimum
18
16
15 total head
3,000 6,000 12,000 FIGURE 3-16
3
Flow rate, m /d System total head curves.
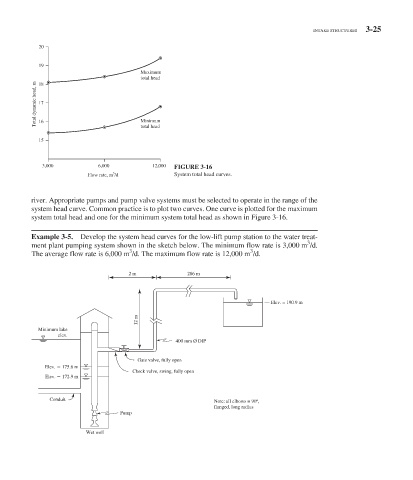
river. Appropriate pumps and pump valve systems must be selected to operate in the range of the
system head curve. Common practice is to plot two curves. One curve is plotted for the maximum
system total head and one for the minimum system total head as shown in Figure 3-16 .
Example 3-5. Develop the system head curves for the low-lift pump station to the water treat-
3
ment plant pumping system shown in the sketch below. The minimum flow rate is 3,000 m /d.
3
3
The average flow rate is 6,000 m /d. The maximum flow rate is 12,000 m /d.
2 m 286 m
— Elev. = 190.9 m
12 m
Minimum lake
elev.
400 mm Ø DIP
Gate valve, fully open
Elev. 175.6 m
Check valve, swing, fully open
Elev. 172.9 m
Conduit Note: all elbows = 90º,
flanged, long radius
Pump
Wet well