
Page 262 - Water and wastewater engineering
P. 262
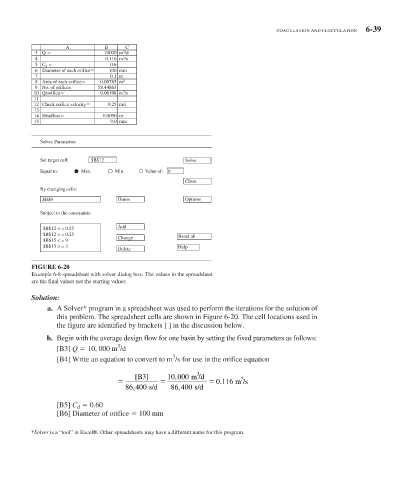
COAGULATION AND FLOCCULATION 6-39

                    A          B     C
            3 Q               10000 m 3 /d
            4                  0.116  m 3 /s
            5 C d               0.6
            6  Diameter of each orifice   100 mm
            7                   0.1  m
            8  Area of each orifice   0.00785  m 2
            9  No. of orifices   58.44863
            10  Q/orifice    0.00198 m 3 /s
           11
           12 Check orifice velocity   0.25  m/s
           13
           14 Headloss        0.0090 m
           15                   9.0  mm

            Solver Parameters

            Set target cell:  $B$12                  Solve
            Equal to:    Max.     Min.     Value of:    0
                                                     Close
            By changing cells:
             $B$9                 Guess              Options

            Subject to the constraints:
             $B$12 < = 0.55       Add
             $B$12 > = 0.25                        Reset all
             $B$15 < = 9          Change
             $B$15 > = 3                           Help
                                  Delete
          FIGURE 6-20
          Example 6-8 spreadsheet with solver dialog box. The values in the spreadsheet
          are the final values not the starting values.
            Solution:
                a.  A Solver* program in a spreadsheet was used to perform the iterations for the solution of
                 this problem. The spreadsheet cells are shown in  Figure 6-20 . The cell locations used in
                 the figure are identified by brackets [ ] in the discussion below.

               b.  Begin with the average design flow for one basin by setting the fixed parameters as follows:
                                  3
                 [B3]  Q      10, 000 m  /d
                                                  3
                 [B4] Write an equation to convert to m  /s for use in the orifice equation
                                                         3
                                       [B3 ]    10 000  m /d
                                                  ,
                                                                     3
                                                              0 116 m /s
                                                               .
                                                   ,
                                       ,
                                    86 400  s/d  86 400  s/d
                   [B5]  C    d        0.60
                 [B6] Diameter of orifice     100 mm
          *Solver is a “tool” in Excel®. Other spreadsheets may have a different name for this program.