
Page 463 - Water and wastewater engineering
P. 463
11-36 WATER AND WASTEWATER ENGINEERING
without good maintenance they may overshoot the set point and “hunt” for the correct position, or
possibly attempt to balance the flow in steps that result in surges to the filters that remain on line.
In the weir splitting system, water flows in through a common channel and is split equally to
all operating filters by the weir. This system is the simplest method for splitting the flow, and rate
changes are made gradually without the hunting of control valves.
In declining rate filtration no active control or apportionment is used. Each filter receives a
different flow rate depending on the accumulated headloss. The cleanest filters receive the great-
est flow, and the flow through each filter declines as solids accumulate. The advantage of this
system is that it can be constructed without instrumentation or flow control. The disadvantages
are that the operators have no indication of the flow rate or headloss, there is no method to control
the filtration rate, and the rate at the beginning of filtration after cleaning may exceed the design
filtration rate resulting in turbidity breakthrough.
Headloss Accommodation
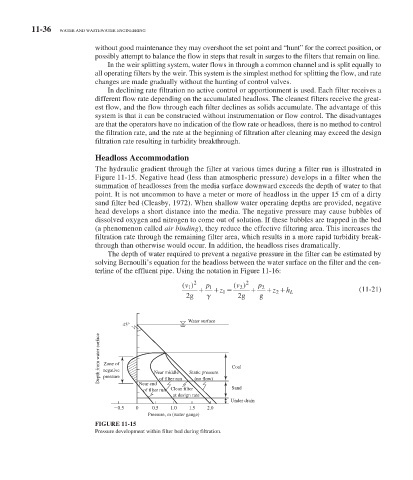
The hydraulic gradient through the filter at various times during a filter run is illustrated in
Figure 11-15 . Negative head (less than atmospheric pressure) develops in a filter when the
summation of headlosses from the media surface downward exceeds the depth of water to that
point. It is not uncommon to have a meter or more of headloss in the upper 15 cm of a dirty
sand filter bed (Cleasby, 1972). When shallow water operating depths are provided, negative
head develops a short distance into the media. The negative pressure may cause bubbles of
dissolved oxygen and nitrogen to come out of solution. If these bubbles are trapped in the bed
(a phenomenon called air binding ), they reduce the effective filtering area. This increases the
filtration rate through the remaining filter area, which results in a more rapid turbidity break-
through than otherwise would occur. In addition, the headloss rises dramatically.
The depth of water required to prevent a negative pressure in the filter can be estimated by
solving Bernoulli’s equation for the headloss between the water surface on the filter and the cen-
terline of the effluent pipe. Using the notation in Figure 11-16 :
() 2 p 1 z ( ) 2 p 2 z h (11-21)
v
v
1
2
2g 1 2g g 2 L
Water surface
45°
Depth from water surface negative Near middle Static pressure Coal
Zone of
pressure
of filter run
Near end
of filter run Clean filter (no flow) Sand
at design rate
Under drain
0.5 0 0.5 1.0 1.5 2.0
Pressure, m (water gauge)
FIGURE 11-15
Pressure development within filter bed during filtration.