
Page 94 - Whole Earth Geophysics An Introductory Textbook For Geologists And Geophysicists
P. 94
large
resolve the crustal
Moho (h).
text. Inversion equations can
77
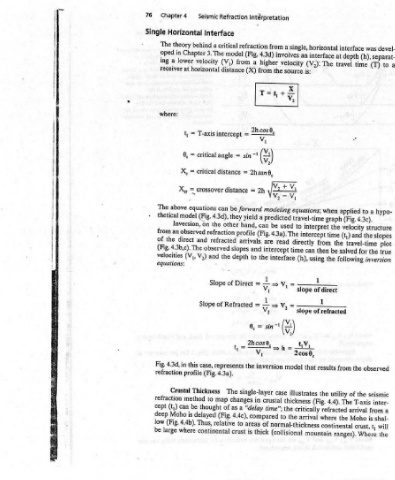
lengths, where a shorter T-intercept of about 3 s might be expected. c)
and
shorter
is
lengths
thin
thickness. The
results in
t,
read from observed
regions of very
basins),
thick
Models
to
spread
the depth
much
600 km), and
is
to
for different crustal
ocean
crust
Interpretation
be about 350 km
refraction
areas,
resolve
Oceans and
the
margins;
apparent velocities are
lengths (=
in
to
where
modeling equations presented
continental
necessary
thickness,
b)
receiver must
is about 8s.
continental
and crossover distances (X,,)
long spread
large
lengths (2X,,)
is
crustal
in
regions of typical continental crust; the T-axis intercept
(X,,)
and
very
the farthest
passive
km)
(t,)
resolve
distance
approximate spread
if the T-axis intercept
necessi
(=300-600
zones;
The travel-time graphs were determined using forward
from the source to
to
times (t,)
ranges
crossover
order
150 km spread
rift
(continental
in
Comparisons of intercept
In
the
long
thickness
the
crust.
models illustrate
m¢
refraction profiles. a) The distance
some
require about
13s).
Similarly,
very
thin
to interpret crustal
h
thin
times (+
be
for
is
Very deep Moho b
small.
grossly simplified
small
continental crust
crust
must
intercept
4.4
thickness in
FIGURE
used
T-axis
be
EBT
ID
SUT
RO
Eee
devel- a Normal Lo Continental to a kK e X, 2 re we 175k * 1 METRE NERO TREY 7 re slopes plot true ETT Te RE RTE TRAN AMET REPS oceans. the in km) 100-150 (= weathered beneath bedrock Hard Bedrock to Depth sedi- loose or material surveying Refraction refraction. critical in results deposits mentary an therefore is inter- mapping for tool effective projects engineer
-
was (h), separat- (T) 43e) structure the travel-time the for inversion observed seismic the T-axis from is crust, t, Where
interface depth at travel time a applied Fig. velocity and (t,) the solved following from the utility of The arrival Moho the ranges).
horizontal interface The when graph interpret the time from be then using the cess Mt! of direct of refracted results the 4.4). (Fig. refracted where continental mountain
single, an (V.): is: uations; revel ile to intercept directly can time (h), slope a slope tiV, 0, 2cos that illustrates thickness critically arrival normal-thickness
a from involves velocity source the V,+V, Vv,-V, e modeling sredicied used be The read intercept =>V,= 200 (Zt) AY; a fh model case the time”; the to (collisional
Intérpretation refraction 4.3d) (Fig. higher a from (X) 2hcos 0, Vv, () =! V, 2han@, 2h = forward yield a hand, can (Fig. 4.3a). arrivals. are and A = A 1 V, = sin 0, 2hcos 0, V, inversion the single-layer crustal in “delay compared areas of thick is
Refraction critical model from (V,) distance = intercept angle sin = distance = distance can be they other profile refracted slopes Direct of Refracted t= represents The changes a as of 4.4c), (Fig. relative to crust
Seismic Interface a behind Chapter 3. The velocity horizontal T-axis = ll critical I critical = crossover equations 4.3d), (Fig. the on refraction observed and The observed s Slope Slope of this case, profile (Fig. 4.3a). Thickness method map to thought be delayed is 4.4b). Thus, continental
Chapter4 Horizontal theory The oped in ing lower a receiver at where: t, a » ¢ = X, cr above The model thetical Inversion, an from the direct (Fig. 4.3b,c). equations: in Fig. 4.3d, refraction Crustal refraction can (t,) deep Moho (Fig. large where
76 Single of cept low be