
Page 64 - Fluid Power Engineering
P. 64
42 Chapter Four
FIGURE 4-1 Airfoil Upper Chord
terminology. surface line
ν 1
Leading Lower Trailing
edge surface edge
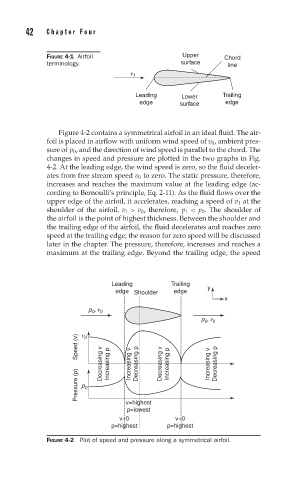
Figure 4-2 contains a symmetrical airfoil in an ideal fluid. The air-
foil is placed in airflow with uniform wind speed of v 0 , ambient pres-
sure of p 0 , and the direction of wind speed is parallel to the chord. The
changes in speed and pressure are plotted in the two graphs in Fig.
4-2. At the leading edge, the wind speed is zero, so the fluid deceler-
ates from free stream speed v 0 to zero. The static pressure, therefore,
increases and reaches the maximum value at the leading edge (ac-
cording to Bernoulli’s principle, Eq. 2-11). As the fluid flows over the
upper edge of the airfoil, it accelerates, reaching a speed of v 1 at the
shoulder of the airfoil. v 1 > v 0 , therefore, p 1 < p 0 . The shoulder of
the airfoil is the point of highest thickness. Between the shoulder and
the trailing edge of the airfoil, the fluid decelerates and reaches zero
speed at the trailing edge; the reason for zero speed will be discussed
later in the chapter. The pressure, therefore, increases and reaches a
maximum at the trailing edge. Beyond the trailing edge, the speed
Leading Trailing
y
edge Shoulder edge
x
p 0 , ν 0
p 0 , ν 0
Speed (v) ν 0 Decreasing v Increasing p Increasing v Decreasing p Decreasing v Increasing p Increasing v Decreasing p
Pressure (p) p 0
v=highest
p=lowest
v=0 v=0
p=highest p=highest
FIGURE 4-2 Plot of speed and pressure along a symmetrical airfoil.