
Page 201 - Wind Energy Handbook
P. 201
THE PERFORMANCE CURVES 175
0.5
0.4
One blade
0.3
Two blades
C
P Three blades
Four blades
0.2 Five blades
0.1
0
0 5 10 15
λ
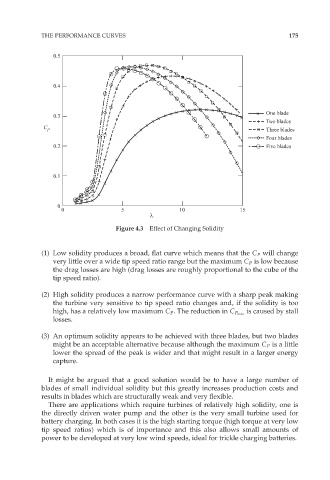
Figure 4.3 Effect of Changing Solidity
(1) Low solidity produces a broad, flat curve which means that the C P will change
very little over a wide tip speed ratio range but the maximum C P is low because
the drag losses are high (drag losses are roughly proportional to the cube of the
tip speed ratio).
(2) High solidity produces a narrow performance curve with a sharp peak making
the turbine very sensitive to tip speed ratio changes and, if the solidity is too
is caused by stall
high, has a relatively low maximum C P . The reduction in C P max
losses.
(3) An optimum solidity appears to be achieved with three blades, but two blades
might be an acceptable alternative because although the maximum C P is a little
lower the spread of the peak is wider and that might result in a larger energy
capture.
It might be argued that a good solution would be to have a large number of
blades of small individual solidity but this greatly increases production costs and
results in blades which are structurally weak and very flexible.
There are applications which require turbines of relatively high solidity, one is
the directly driven water pump and the other is the very small turbine used for
battery charging. In both cases it is the high starting torque (high torque at very low
tip speed ratios) which is of importance and this also allows small amounts of
power to be developed at very low wind speeds, ideal for trickle charging batteries.