
Page 199 - Wind Energy Handbook
P. 199
4
Wind-turbine Performance
4.1 The Performance Curves
The performance of a wind turbine can be characterized by the manner in which
the three main indicators—power, torque and thrust—vary with wind speed. The
power determines the amount of energy captured by the rotor, the torque
developed determines the size of the gear box and must be matched by whatever
generator is being driven by the rotor. The rotor thrust has great influence on the
structural design of the tower. It is usually convenient to express the perform-
ance by means of non-dimensional, characteristic performance curves from which
the actual performance can be determined regardless of how the turbine is
operated, e.g., at constant rotational speed or some regime of variable rotor
speed. Assuming that the aerodynamic performance of the rotor blades does not
deteriorate the non-dimensional aerodynamic performance of the rotor will
depend upon the tip speed ratio and, if appropriate, the pitch setting of the
blades. It is usual, therefore, to display the power, torque and thrust coefficients
as functions of tip speed ratio.
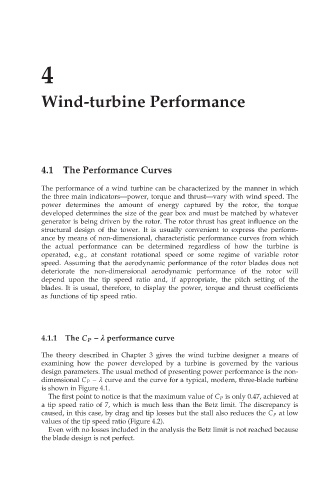
4.1.1 The C P – º performance curve
The theory described in Chapter 3 gives the wind turbine designer a means of
examining how the power developed by a turbine is governed by the various
design parameters. The usual method of presenting power performance is the non-
dimensional C P – º curve and the curve for a typical, modern, three-blade turbine
is shown in Figure 4.1.
The first point to notice is that the maximum value of C P is only 0.47, achieved at
a tip speed ratio of 7, which is much less than the Betz limit. The discrepancy is
caused, in this case, by drag and tip losses but the stall also reduces the C P at low
values of the tip speed ratio (Figure 4.2).
Even with no losses included in the analysis the Betz limit is not reached because
the blade design is not perfect.