
Page 466 - Wind Energy Handbook
P. 466
440 COMPONENT DESIGN
has been represented as connected to a distribution network with a low short-circuit
level (and hence a high impedance) and the impedance of the local turbine
transformer is included in the calculation. This source impedance acts to lower the
maximum power which may be exported before the peak of the curve is reached,
and instability occurs. It also leads to asymmetry in the torque–slip curve.
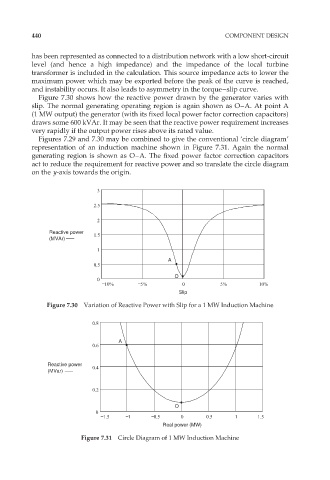
Figure 7.30 shows how the reactive power drawn by the generator varies with
slip. The normal generating operating region is again shown as O–A. At point A
(1 MW output) the generator (with its fixed local power factor correction capacitors)
draws some 600 kVAr. It may be seen that the reactive power requirement increases
very rapidly if the output power rises above its rated value.
Figures 7.29 and 7.30 may be combined to give the conventional ‘circle diagram’
representation of an induction machine shown in Figure 7.31. Again the normal
generating region is shown as O–A. The fixed power factor correction capacitors
act to reduce the requirement for reactive power and so translate the circle diagram
on the y-axis towards the origin.
3
2.5
2
Reactive power
1.5
(MVAr)
1
A
0.5
O
0
10% 5% 0 5% 10%
Slip
Figure 7.30 Variation of Reactive Power with Slip for a 1 MW Induction Machine
0.8
A
0.6
Reactive power
0.4
(MVar)
0.2
O
0
1.5 1 0.5 0 0.5 1 1.5
Real power (MW)
Figure 7.31 Circle Diagram of 1 MW Induction Machine