
Page 131 - Wire Bonding in Microelectronics
P. 131
W ir e Bond Testing 109
4.3.8 Comparison of the Ball-Shear and the Bond-Pull Tests
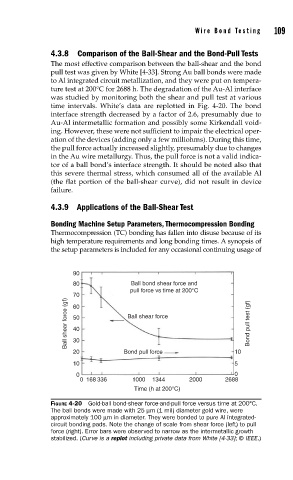
The most effective comparison between the ball-shear and the bond
pull test was given by White [4-33]. Strong Au ball bonds were made
to Al integrated circuit metallization, and they were put on tempera-
ture test at 200°C for 2688 h. The degradation of the Au-Al interface
was studied by monitoring both the shear and pull test at various
time intervals. White’s data are replotted in Fig. 4-20. The bond
interface strength decreased by a factor of 2.6, presumably due to
Au-Al intermetallic formation and possibly some Kirkendall void-
ing. However, these were not sufficient to impair the electrical oper-
ation of the devices (adding only a few milliohms). During this time,
the pull force actually increased slightly, presumably due to changes
in the Au wire metallurgy. Thus, the pull force is not a valid indica-
tor of a ball bond’s interface strength. It should be noted also that
this severe thermal stress, which consumed all of the available Al
(the flat portion of the ball-shear curve), did not result in device
failure.
4.3.9 Applications of the Ball-Shear Test
Bonding Machine Setup Parameters, Thermocompression Bonding
Thermocompression (TC) bonding has fallen into disuse because of its
high temperature requirements and long bonding times. A synopsis of
the setup parameters is included for any occasional continuing usage of
90
80 Ball bond shear force and
pull force vs time at 200°C
70
Ball shear force (gf) 50 Ball shear force Bond pull test (gf)
60
40
30
20 Bond pull force 10
10 5
0 0
0 168 336 1000 1344 2000 2688
Time (h at 200°C)
FIGURE 4-20 Gold-ball bond-shear force-and-pull force versus time at 200°C.
The ball bonds were made with 25 µm (1 mil) diameter gold wire, were
approximately 100 µm in diameter. They were bonded to pure Al integrated-
circuit bonding pads. Note the change of scale from shear force (left) to pull
force (right). Error bars were observed to narrow as the intermetallic growth
stabilized. (Curve is a replot including private data from White [4-33]; © IEEE.)