
Page 144 - Wire Bonding in Microelectronics
P. 144
122 Cha pte r F o u r
that work. A normal distribution destructive bond-pull control limit
–
of (x − 3σ), often used in the electronics industry, assures that only
one normal distribution bond out of 740 will have a pull force below
that value (note that bond pull forces in a large population may not
–
be normal, see Sec. 4.2.2). Reducing the NDP force 10% to 0.9(x − 3σ),
–
where σ ≤ 0.25 x, will assure that no bond within the normal (x − 3σ)
distribution is stressed past its elastic limit, whereas any freaks (bonds
with low, non-normal, bimodal, etc., pull forces) will be weeded out.
–
Only those bonds whose pull force lies in the range of (x − 3σ) to
–
0.9(x − 3σ) may be stressed, to some degree, beyond their elastic lim-
its. All bonds with pull forces below that range will be broken, and all
bonds with pull forces above it will only be stressed within their elastic
limits. The actual percentage of bonds that lie within the inelastic stress
–
range will depend on the relationship between x and σ.
In cases where very low standard deviations are encountered (σ ≤
–
0.15 x), as may happen in volume production using autobonders, the
–
NDP force can be changed to 0.9(x – 4σ). In this case, no more than
one normal distribution bond out of ~30,000 would be stressed past
–
–
its elastic limits. In a situation where x = 6 gf and σ = 0.15 x, the NDP
.
force would be approximately 2.1 gf, and only one normal-distribu-
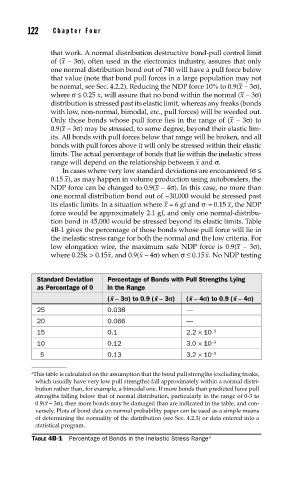
tion bond in 45,000 would be stressed beyond its elastic limits. Table
4B-1 gives the percentage of those bonds whose pull force will lie in
the inelastic stress range for both the normal and the low criteria. For
–
low elongation wire, the maximum safe NDP force is 0.9(x – 3σ),
–
–
–
where 0.25k > 0.15x, and 0.9(x – 4σ) when σ ≤ 0.15 x. No NDP testing
Standard Deviation Percentage of Bonds with Pull Strengths Lying
as Percentage of 0 in the Range
¯
(x - 3r) to 0.9 (x - 3r) (x - 4r) to 0.9 (x - 4r)
¯
¯
¯
25 0.038 —
20 0.066 —
15 0.1 2.2 × 10 −3
10 0.12 3.0 × 10 −3
5 0.13 3.2 × 10 −3
a This table is calculated on the assumption that the bond pull strengths (excluding freaks,
which usually have very low pull strengths) fall approximately within a normal distri-
bution rather than, for example, a bimodal one. If more bonds than predicted have pull
strengths falling below that of normal distribution, particularly in the range of 0-3 to
0.9(x − 3σ), then more bonds may be damaged than are indicated in the table, and con-
¯
versely. Plots of bond data on normal probability paper can be used as a simple means
of determining the normality of the distribution (see Sec. 4.2.3) or data entered into a
statistical program.
TABLE 4B-1 Percentage of Bonds in the Inelastic Stress Range a