
Page 402 - Characterization and Properties of Petroleum Fractions - M.R. Riazi
P. 402
QC: IML/FFX
T1: IML
P2: IML/FFX
P1: IML/FFX
14:25
June 22, 2007
AT029-Manual
AT029-Manual-v7.cls
AT029-09
382 CHARACTERIZATION AND PROPERTIES OF PETROLEUM FRACTIONS
330
Vapor , V moles
Experimental
y i
Predicted
320
Liquid , L moles
WPT, K x i L
Pure Solid Layer 1
310 S
n moles
1
Pure Solid Layer j
n S j moles N S separate
300
Layer N S -1 solid layers
0 100 200 300 400 500
n S
Pressure, bar N S 1 − moles
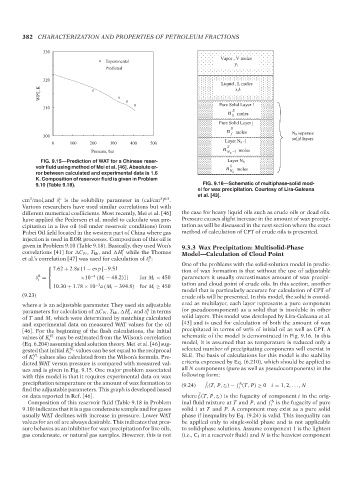
FIG. 9.15—Prediction of WAT for a Chinese reser- Layer N S
voir fluid using method of Mei et al. [46]. Absolute er- n S moles
ror between calculated and experimental data is 1.6 N S
K. Composition of reservoir fluid is given in Problem
9.10 (Table 9.18). FIG. 9.16—Schematic of multiphase-solid mod-
el for wax precipitation. Courtesy of Lira-Galeana
et al. [43].
3 L 3 0.5
cm /mol,and δ i is the solubility parameter in (cal/cm ) .
Various researchers have used similar correlations but with
different numerical coefficients. Most recently, Mei et al. [46] the case for heavy liquid oils such as crude oils or dead oils.
have applied the Pedersen et al. model to calculate wax pre- Pressure causes slight increase in the amount of wax precipi-
cipitation in a live oil (oil under reservoir conditions) from tation as will be discussed in the next section where the exact
Pubei Oil field located in the western part of China where gas method of calculation of CPT of crude oils is presented.
injection is used in EOR processes. Composition of this oil is
given in Problem 9.10 (Table 9.18). Basically, they used Won’s 9.3.3 Wax Precipitation: Multisolid-Phase
f
correlations [41] for C Pi , T Mi , and H while the Thomas
i Model—Calculation of Cloud Point
S
et al.’s correlation [47] was used for calculation of δ :
i
One of the problems with the solid-solution model in predic-
⎪ 7.62 + 2.8a {1 − exp [−9.51 tion of wax formation is that without the use of adjustable
⎧
⎨
S −4
δ = ×10 (M i − 48.2)]} for M i < 450 parameters it usually overestimates amount of wax precipi-
i
⎪ tation and cloud point of crude oils. In this section, another
⎩ −3
10.30 + 1.78 × 10 a (M i − 394.8) for M i ≥ 450
model that is particularly accurate for calculation of CPT of
(9.23) crude oils will be presented. In this model, the solid is consid-
where a is an adjustable parameter. They used six adjustable ered as multilayer, each layer represents a pure component
S
f
parameters for calculation of C Pi , T Mi , H , and δ in terms (or pseudocomponent) as a solid that is insoluble in other
i i
of T and M, which were determined by matching calculated solid layers. This model was developed by Lira-Galeana et al.
and experimental data on measured WAT values for the oil [43] and is used for calculation of both the amount of wax
[46]. For the beginning of the flash calculations, the initial precipitated in terms of wt% of initial oil as well as CPT. A
values of K VL may be estimated from the Wilson’s correlation schematic of the model is demonstrated in Fig. 9.16. In this
i
(Eq. 6.204) assuming ideal solution theory. Mei et al. [46] sug- model, it is assumed that as temperature is reduced only a
gested that initial K SL values can be set equal to the reciprocal selected number of precipitating components will coexist in
i
of K i VL --`,```,`,``````,`,````,```,,-`-`,,`,,`,`,,`--- values also calculated from the Wilson’s formula. Pre- SLE. The basis of calculations for this model is the stability
dicted WAT versus pressure is compared with measured val- criteria expressed by Eq. (6.210), which should be applied to
ues and is given in Fig. 9.15. One major problem associated all N components (pure as well as pseudocomponents) in the
with this model is that it requires experimental data on wax following form:
precipitation temperature or the amount of wax formation to (9.24) f i (T, P, z i ) − f (T, P) ≥ 0 i = 1, 2, ... , N
ˆ
S
find the adjustable parameters. This graph is developed based i
ˆ
on data reported in Ref. [46]. where f i (T, P, z i ) is the fugacity of component i in the orig-
S
Composition of this reservoir fluid (Table 9.18 in Problem inal fluid mixture at T and P, and f is the fugacity of pure
i
9.10) indicates that it is a gas condensate sample and for gases solid i at T and P. A component may exist as a pure solid
usually WAT declines with increase in pressure. Lower WAT phase if inequality by Eq. (9.24) is valid. This inequality can
values for an oil are always desirable. This indicates that pres- be applied only to single-solid phase and is not applicable
sure behaves as an inhibitor for wax precipitation for live oils, to solid-phase solutions. Assume component 1 is the lightest
gas condensate, or natural gas samples. However, this is not (i.e., C 1 in a reservoir fluid) and N is the heaviest component
Copyright ASTM International
Provided by IHS Markit under license with ASTM Licensee=International Dealers Demo/2222333001, User=Anggiansah, Erick
No reproduction or networking permitted without license from IHS Not for Resale, 08/26/2021 21:56:35 MDT