
Page 399 - Characterization and Properties of Petroleum Fractions - M.R. Riazi
P. 399
P2: IML/FFX
QC: IML/FFX
P1: IML/FFX
T1: IML
AT029-Manual-v7.cls
14:25
AT029-09
AT029-Manual
2500.0 June 22, 2007 9. APPLICATIONS: PHASE EQUILIBRIUM CALCULATIONS 379
2000.0 L
Pressure (psia) 1500.0 1000.0 L
LV
500.0
0.0
0.0 25 50 75 100.0
Mole Percent CO 2
(a)
1400.0 1380.0
1300.0
1200.0
L
Pressure (psia) 1100.0 LS
1000.0
900.0 908.5
891.5
LV LVS
800.0
98.0 98.5 99.0 99.5 100.0
Mole Percent CO 2
(b)
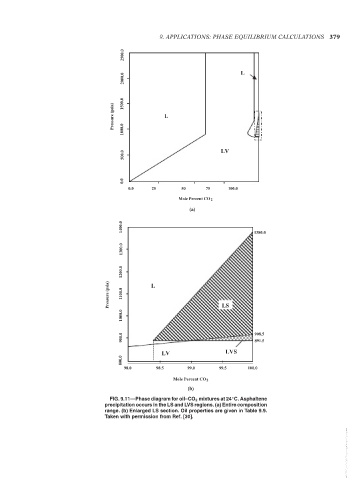
FIG. 9.11—Phase diagram for oil–CO 2 mixtures at 24 C. Asphaltene
◦
precipitation occurs in the LS and LVS regions. (a) Entire composition
range. (b) Enlarged LS section. Oil properties are given in Table 9.9.
Taken with permission from Ref. [30].
--`,```,`,``````,`,````,```,,-`-`,,`,,`,`,,`---
Copyright ASTM International
Provided by IHS Markit under license with ASTM Licensee=International Dealers Demo/2222333001, User=Anggiansah, Erick
No reproduction or networking permitted without license from IHS Not for Resale, 08/26/2021 21:56:35 MDT