
Page 101 - Petroleum Production Engineering, A Computer-Assisted Approach
P. 101
Guo, Boyun / Computer Assited Petroleum Production Engg 0750682701_chap07 Final Proof page 93 3.1.2007 8:47pm Compositor Name: SJoearun
FORECAST OF WELL PRODUCTION 7/93
Table 7.5 Production Schedule Forecast
p-bar (psia) q o (stb=d) DN p (stb) N p (stb) DG p (scf) G p (scf) Dt (d) t (d)
4,500
393 2.8Eþ04 2.37Eþ07 70
4,300 27,601 2.37Eþ07 7.02Eþ01
363 8.0Eþ04 9.36Eþ07 219
4,100 107,217 1.17Eþ08 2.90Eþ02
336 5.3Eþ04 8.89Eþ07 159
3,900 160,565 2.06Eþ08 4.48Eþ02
305 5.2Eþ04 1.25Eþ08 170
3,700 212,442 3.31Eþ08 6.18Eþ02
276 3.5Eþ04 1.10Eþ08 128
3,500 247,824 4.42Eþ08 7.47Eþ02
248 3.0Eþ04 1.16Eþ08 121
3,300 277,848 5.58Eþ08 8.68Eþ02
217 2.6Eþ04 1.21Eþ08 119
3,100 303,716 6.79Eþ08 9.87Eþ02
187 2.4Eþ04 1.28Eþ08 126
2,900 327,302 8.07Eþ08 1.11Eþ03
155 2.0Eþ04 1.25Eþ08 129
2,700 347,354 9.32Eþ08 1.24Eþ03
120 1.8Eþ04 1.27Eþ08 149
2,500 365,268 1.06Eþ09 1.39Eþ03
Constant TPR is usually assumed if liquid loading is not a Water saturation: 0.27
problem and the wellhead pressure is kept constant over time. Gas-specific gravity: 0:7 air ¼ 1
The gas production schedule can be established through Total compressibility: 1:5 10 4 psi 1
the material balance equation, Darcy skin factor: 0
!
p p Non-Darcy flow coefficient: 0
z , (7:17) Drainage area: 40 acres
G p ¼ G i 1 p i
Wellbore radius: 0.328 ft
z i
Tubing inner diameter: 2.441 in.
where G p and G i are the cumulative gas production and Desired flowing bottom-hole
initial ‘‘gas in place,’’ respectively. pressure: 1,500 psia
If the gas production rate is predicted by Nodal analysis
at a given reservoir pressure level and the cumulative gas Solution The spreadsheet program Carr-Kobayashi-
production is estimated with Eq. (7.17) at the same reservoir Burrows-GasViscosity.xls gives a gas viscosity value of
pressure level, the corresponding production time can be 0.0251 cp at the initial reservoir pressure of 4,613 psia
calculated and, thus, production forecast can be carried out. and temperature of 180 8F for the 0.7 specific gravity
gas. The spreadsheet program Hall-Yarborogh-z.xls gives
Example Problem 7.4 Use the following data and develop a z-factor value of 1.079 at the same conditions.
a forecast of a well production after transient flow until the Formation volume factor at the initial reservoir pressure
average reservoir pressure declines to 2,000 psia:
is calculated with Eq. (2.62):
Reservoir depth: 10,000 ft
Initial reservoir pressure: 4,613 psia B gi ¼ 0:0283 (1:079)(180 þ 460) ¼ 0:004236 ft =scf
3
Reservoir temperature: 180 8F 4,613
Pay zone thickness: 78 ft
Formation permeability: 0.17 md The initial ‘‘gas in place’’ within the 40 acres is
Formation porosity: 0.14
450 4.0E+05
400 3.5E+05
350 3.0E+05
Production Rate (stb/d) 250 2.5E+05 Cumulative Production (stb)
300
2.0E+05
200
1.5E+05
150
100
Cumulative Production
5.0E+04
50 Production Rate 1.0E+05
0 0.0E+00
0 10 20 30 40 50
Two-Phase Production Time (months)
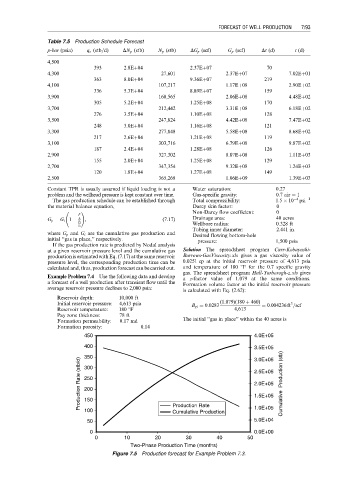
Figure 7.5 Production forecast for Example Problem 7.3.