
Page 98 - Petroleum Production Engineering, A Computer-Assisted Approach
P. 98
Guo, Boyun / Computer Assited Petroleum Production Engg 0750682701_chap07 Final Proof page 90 3.1.2007 8:47pm Compositor Name: SJoearun
7/90 PETROLEUM PRODUCTION ENGINEERING FUNDAMENTALS
5,000
IPR for reservoir pressure 5,426 psia
4,500 IPR for reservoir pressure 5,300 psia
IPR for reservoir pressure 5,200 psia
Flowing Bottom Hole Pressure (psia) 3,000 IPR for reservoir pressure 4,800 psia
IPR for reservoir pressure 5,100 psia
4,000
IPR for reservoir pressure 5,000 psia
IPR for reservoir pressure 4,900 psia
3,500
IPR for reservoir pressure 4,700 psia
IPR for reservoir pressure 4,600 psia
IPR for reservoir pressure 4,500 psia
TPR
2,500
2,000
1,500
1,000
500
0
100 300 500 700 900 1,100 1,300
Production Rate (stb/day)
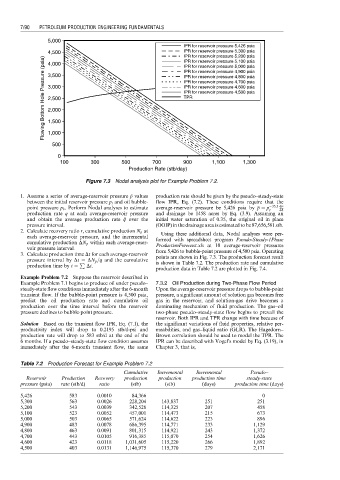
Figure 7.3 Nodal analysis plot for Example Problem 7.2.
1. Assume a series of average-reservoir pressure p ¯ values production rate should be given by the pseudo–steady-state
between the initial reservoir pressure p i and oil bubble- flow IPR, Eq. (7.2). These conditions require that the
point pressure p b . Perform Nodal analyses to estimate average-reservoir pressure be 5,426 psia by p ¼ p 35:3 q
p
e
kh
production rate q at each average-reservoir pressure and drainage be 1458 acres by Eq. (3.9). Assuming an
and obtain the average production rate q ¯ over the initial water saturation of 0.35, the original oil in place
pressure interval. (OOIP) in the drainage area is estimated to be 87,656,581 stb.
2. Calculate recovery ratio r, cumulative production N p at Using these additional data, Nodal analyses were per-
each average-reservoir pressure, and the incremental formed with spreadsheet program Pseudo-Steady-1Phase
cumulative production DN p within each average-reser- ProductionForecast.xls at 10 average-reservoir pressures
voir pressure interval. from 5,426 to bubble-point pressure of 4,500 psia. Operating
3. Calculate production time Dt for each average-reservoir points are shown in Fig. 7.3. The production forecast result
q
pressure interval by Dt ¼ DN p = q and the cumulative is shown in Table 7.2. The production rate and cumulative
P
production time by t ¼ Dt.
production data in Table 7.2 are plotted in Fig. 7.4.
Example Problem 7.2 Suppose the reservoir described in
Example Problem 7.1 begins to produce oil under pseudo– 7.3.2 Oil Production during Two-Phase Flow Period
steady-state flow conditions immediately after the 6-month Upon the average-reservoir pressure drops to bubble-point
transient flow. If the bubble-point pressure is 4,500 psia, pressure, a significant amount of solution gas becomes free
predict the oil production rate and cumulative oil gas in the reservoir, and solution-gas drive becomes a
production over the time interval before the reservoir dominating mechanism of fluid production. The gas–oil
pressure declines to bubble-point pressure. two-phase pseudo–steady-state flow begins to prevail the
reservoir. Both IPR and TPR change with time because of
Solution Based on the transient flow IPR, Eq. (7.1), the the significant variations of fluid properties, relative per-
productivity index will drop to 0.2195 stb/d-psi and meabilities, and gas–liquid ratio (GLR). The Hagedorn–
production rate will drop to 583 stb/d at the end of the Brown correlation should be used to model the TPR. The
6 months. If a pseudo–steady-state flow condition assumes IPR can be described with Vogel’s model by Eq. (3.19), in
immediately after the 6-month transient flow, the same Chapter 3, that is,
Table 7.2 Production Forecast for Example Problem 7.2
Cumulative Incremental Incremental Pseudo–
Reservoir Production Recovery production production production time steady-state
pressure (psia) rate (stb/d) ratio (stb) (stb) (days) production time (days)
5,426 583 0.0010 84,366 0
5,300 563 0.0026 228,204 143,837 251 251
5,200 543 0.0039 342,528 114,325 207 458
5,100 523 0.0052 457,001 114,473 215 673
5,000 503 0.0065 571,624 114,622 223 896
4,900 483 0.0078 686,395 114,771 233 1,129
4,800 463 0.0091 801,315 114,921 243 1,372
4,700 443 0.0105 916,385 115,070 254 1,626
4,600 423 0.0118 1,031,605 115,220 266 1,892
4,500 403 0.0131 1,146,975 115,370 279 2,171