
Page 159 - Petroleum Production Engineering, A Computer-Assisted Approach
P. 159
Guo, Boyun / Computer Assited Petroleum Production Engg 0750682701_chap11 Final Proof page 154 3.1.2007 8:54pm Compositor Name: SJoearun
11/154 EQUIPMENT DESIGN AND SELECTION
Table 11.6 Base Data for Pipeline Insulation Design presented in Table 11.6. The design criterion is to ensure
that the temperature at any point in the pipeline will not
Length of pipeline: 8,047 M drop to less than 25 8C, as required by flow assurance.
Outer diameter of pipe: 0.2032 M Insulation materials considered for the project were
Wall thickness: 0.00635 M polyethylene, polypropylene, and polyurethane.
Fluid density: 881 kg=M 3
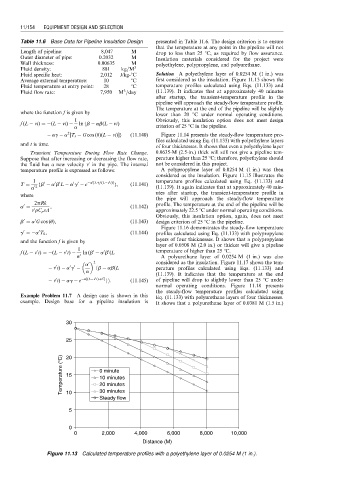
Fluid specific heat: 2,012 J/kg-8C Solution A polyethylene layer of 0.0254 M (1 in.) was
Average external temperature: 10 8C first considered as the insulation. Figure 11.13 shows the
Fluid temperature at entry point: 28 8C temperature profiles calculated using Eqs. (11.133) and
3
Fluid flow rate: 7,950 M =day (11.139). It indicates that at approximately 40 minutes
after startup, the transient-temperature profile in the
pipeline will approach the steady-flow temperature profile.
The temperature at the end of the pipeline will be slightly
where the function f is given by lower than 20 8C under normal operating conditions.
1 Obviously, this insulation option does not meet design
f (L vt) ¼ (L vt) ln {b ab(L vt)
a criterion of 25 8C in the pipeline.
2
ag a [T s G cos (u)(L vt)]} (11:140) Figure 11.14 presents the steady-flow temperature pro-
files calculated using Eq. (11.133) with polyethylene layers
and t is time. of four thicknesses. It shows that even a polyethylene layer
Transient Temperature During Flow Rate Change. 0.0635-M (2.5-in.) thick will still not give a pipeline tem-
Suppose that after increasing or decreasing the flow rate, perature higher than 25 8C; therefore, polyethylene should
the fluid has a new velocity v’ in the pipe. The internal not be considered in this project.
temperature profile is expressed as follows: A polypropylene layer of 0.0254 M (1 in.) was then
considered as the insulation. Figure 11.15 illustrates the
1 0 0 temperature profiles calculated using Eq. (11.133) and
0 0
0
0 0
T ¼ {b a b L a g e a [Lþf (L v t)] }, (11:141)
a 0 2 (11.139). It again indicates that at approximately 40 min-
utes after startup, the transient-temperature profile in
where
the pipe will approach the steady-flow temperature
2pRk profile. The temperature at the end of the pipeline will be
0
a ¼ , (11:142)
0
v rC p sA approximately 22.5 8C under normal operating conditions.
Obviously, this insulation option, again, does not meet
0
0
b ¼ a G cos (u), (11:143) design criterion of 25 8C in the pipeline.
Figure 11.16 demonstrates the steady-flow temperature
0
0
g ¼ a T 0 , (11:144) profiles calculated using Eq. (11.133) with polypropylene
and the function f is given by layers of four thicknesses. It shows that a polypropylene
layer of 0.0508 M (2.0 in.) or thicker will give a pipeline
1
0
0 0
0
0
f (L v t) ¼ (L v t) ln (b a b (L temperature of higher than 25 8C.
a 0 A polyurethane layer of 0.0254 M (1 in.) was also
2 considered as the insulation. Figure 11.17 shows the tem-
0
a
0 0
0
v t) a g {b ab(L perature profiles calculated using Eqs. (11.133) and
a
(11.139). It indicates that the temperature at the end
0
0
v t) ag e a[(L v t)þC] }Þ: (11:145) of pipeline will drop to slightly lower than 25 8C under
normal operating conditions. Figure 11.18 presents
the steady-flow temperature profiles calculated using
Example Problem 11.7 A design case is shown in this Eq. (11.133) with polyurethane layers of four thicknesses.
example. Design base for a pipeline insulation is It shows that a polyurethane layer of 0.0381 M (1.5 in.)
30
25
Temperature ( C) 15 0 minute
20
10 minutes
20 minutes
30 minutes
10
Steady flow
5
0
0 2,000 4,000 6,000 8,000 10,000
Distance (M)
Figure 11.13 Calculated temperature profiles with a polyethylene layer of 0.0254 M (1 in.).