
Page 40 - Petroleum Production Engineering, A Computer-Assisted Approach
P. 40
Guo, Boyun / Computer Assited Petroleum Production Engg 0750682701_chap03 Final Proof page 30 3.1.2007 8:30pm Compositor Name: SJoearun
3/30 PETROLEUM PRODUCTION ENGINEERING FUNDAMENTALS
3.1 Introduction q
Reservoir deliverability is defined as the oil or gas produc-
tion rate achievable from reservoir at a given bottom-hole
pressure. It is a major factor affecting well deliverability. p
Reservoir deliverability determines types of completion
and artificial lift methods to be used. A thorough knowl- h
edge of reservoir productivity is essential for production k m o B o
engineers. p wf
Reservoir deliverability depends on several factors in- r w r
cluding the following:
. Reservoir pressure
. Pay zone thickness and permeability (a)
. Reservoir boundary type and distance
. Wellbore radius
. Reservoir fluid properties
. Near-wellbore condition p
. Reservoir relative permeabilities
r
Reservoir deliverability can be mathematically modeled on r w
the basis of flow regimes such as transient flow, steady
state flow, and pseudo–steady state flow. An analytical p wf
relation between bottom-hole pressure and production k m B
rate can be formulated for a given flow regime. The o o
relation is called ‘‘inflow performance relationship’’
(IPR). This chapter addresses the procedures used for
establishing IPR of different types of reservoirs and well (b)
configurations.
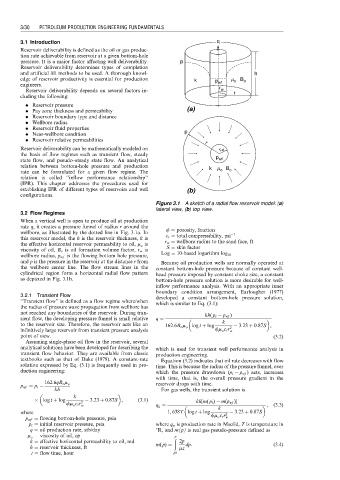
Figure 3.1 A sketch of a radial flow reservoir model: (a)
lateral view, (b) top view.
3.2 Flow Regimes
When a vertical well is open to produce oil at production
rate q, it creates a pressure funnel of radius r around the
wellbore, as illustrated by the dotted line in Fig. 3.1a. In f ¼ porosity, fraction 1
this reservoir model, the h is the reservoir thickness, k is c t ¼ total compressibility, psi
the effective horizontal reservoir permeability to oil, m o is r w ¼ wellbore radius to the sand face, ft
viscosity of oil, B o is oil formation volume factor, r w is S ¼ skin factor
wellbore radius, p wf is the flowing bottom hole pressure, Log ¼ 10-based logarithm log 10
and p is the pressure in the reservoir at the distance r from Because oil production wells are normally operated at
the wellbore center line. The flow stream lines in the constant bottom-hole pressure because of constant well-
cylindrical region form a horizontal radial flow pattern head pressure imposed by constant choke size, a constant
as depicted in Fig. 3.1b. bottom-hole pressure solution is more desirable for well-
inflow performance analysis. With an appropriate inner
boundary condition arrangement, Earlougher (1977)
3.2.1 Transient Flow developed a constant bottom-hole pressure solution,
‘‘Transient flow’’ is defined as a flow regime where/when which is similar to Eq. (3.1):
the radius of pressure wave propagation from wellbore has
not reached any boundaries of the reservoir. During tran- kh( p i p wf )
sient flow, the developing pressure funnel is small relative q ¼
to the reservoir size. Therefore, the reservoir acts like an 162:6B o m o log t þ log k 3:23 þ 0:87S ,
infinitively large reservoir from transient pressure analysis fm o c t r 2 w
point of view. (3:2)
Assuming single-phase oil flow in the reservoir, several
analytical solutions have been developed for describing the which is used for transient well performance analysis in
transient flow behavior. They are available from classic production engineering.
textbooks such as that of Dake (1978). A constant-rate Equation (3.2) indicates that oil rate decreases with flow
solution expressed by Eq. (3.1) is frequently used in pro- time. This is because the radius of the pressure funnel, over
duction engineering: which the pressure drawdown (p i p wf ) acts, increases
with time, that is, the overall pressure gradient in the
p wf ¼ p i 162:6qB o m o reservoir drops with time.
kh For gas wells, the transient solution is
k
log t þ log 3:23 þ 0:87S , (3:1) kh[m( p i ) m(p wf )]
fm o c t r 2 q g ¼ , (3:3)
w k
where 1; 638T log t þ log fm o c t r 2 3:23 þ 0:87S
p wf ¼ flowing bottom-hole pressure, psia w
p i ¼ initial reservoir pressure, psia where q g is production rate in Mscf/d, T is temperature in
q ¼ oil production rate, stb/day 8R, and m(p) is real gas pseudo-pressure defined as
m o ¼ viscosity of oil, cp ð p
k ¼ effective horizontal permeability to oil, md 2p
h ¼ reservoir thickness, ft m( p) ¼ mz dp: (3:4)
t ¼ flow time, hour pb