
Page 42 - Petroleum Production Engineering, A Computer-Assisted Approach
P. 42
Guo, Boyun / Computer Assited Petroleum Production Engg 0750682701_chap03 Final Proof page 32 3.1.2007 8:30pm Compositor Name: SJoearun
3/32 PETROLEUM PRODUCTION ENGINEERING FUNDAMENTALS
Reservoir Shape Reservoir Shape Reservoir Shape Reservoir Shape
Shape & Factor Shape & Factor Shape & Factor Shape & Factor
Well Well Well Well
C A C A
Location Location Location C A Location C A
31.6
1/3 1 1 3.13
21.9 10.8
1 2
2
1
1 30.9 22.6 1 4.86 1 0.607
2
1 2 2
4
31.6 2 12.9 1 2.07 1 5.38
2 2
1 1 27.6 2 5
4.5 1 2.72 1 2.36
1 2 4
1 In water–drive
reservoirs
1
27.1 1 0.111
60 19.1 1 0.232
4 2
In reservoirs of
4 unknown production
character 25 1 0.115 4 0.098
4 3
3.39 4 60
(a) (b)
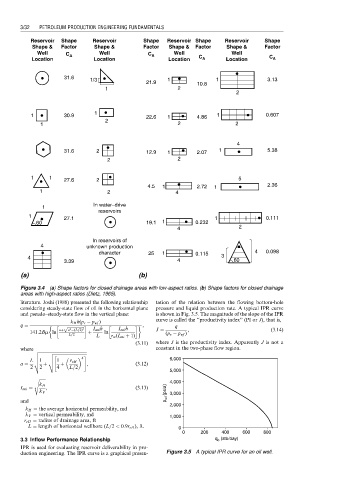
Figure 3.4 (a) Shape factors for closed drainage areas with low-aspect ratios. (b) Shape factors for closed drainage
areas with high-aspect ratios (Dietz, 1965).
literature. Joshi (1988) presented the following relationship tation of the relation between the flowing bottom-hole
considering steady-state flow of oil in the horizontal plane pressure and liquid production rate. A typical IPR curve
and pseudo–steady-state flow in the vertical plane: is shown in Fig. 3.5. The magnitude of the slope of the IPR
k H h(p e p wf ) curve is called the ‘‘productivity index’’ (PI or J), that is,
q ¼ p ffiffiffiffiffiffiffiffiffiffiffiffiffiffiffiffi , q
141:2Bm ln aþ a 2 (L=2) 2 þ I ani h ln I ani h J ¼ (p e p wf ) , (3:14)
L=2 L r w (I ani þ 1)
(3:11) where J is the productivity index. Apparently J is not a
where v ffiffiffiffiffiffiffiffiffiffiffiffiffiffiffiffiffiffiffiffiffiffiffiffiffiffiffiffiffiffiffiffiffiffiffiffiffiffiffiffiffiffiffiffiffi constant in the two-phase flow region.
u v ffiffiffiffiffiffiffiffiffiffiffiffiffiffiffiffiffiffiffiffiffiffiffiffiffiffiffiffiffiffiffi
"
#
u
u
L u 1 u 1 r eH 4 6,000
a ¼ t þ t þ , (3:12)
2 2 4 L=2
5,000
s ffiffiffiffiffiffi
4,000
k H
I ani ¼ , (3:13)
k V p wf (psia) 3,000
and
2,000
k H ¼ the average horizontal permeability, md
k V ¼ vertical permeability, md
1,000
r eH ¼ radius of drainage area, ft
L ¼ length of horizontal wellbore (L=2 < 0:9r eH ), ft.
0
0 200 400 600 800
3.3 Inflow Performance Relationship q o (stb/day)
IPR is used for evaluating reservoir deliverability in pro-
duction engineering. The IPR curve is a graphical presen- Figure 3.5 A typical IPR curve for an oil well.