
Page 47 - Petroleum Production Engineering, A Computer-Assisted Approach
P. 47
Guo, Boyun / Computer Assited Petroleum Production Engg 0750682701_chap03 Final Proof page 37 3.1.2007 8:30pm Compositor Name: SJoearun
RESERVOIR DELIVERABILITY 3/37
p
Reservoir pressure, p ¼ 3,000 psia progressively lower GOR), and so the overall ratio of pro-
Tested flowing bottom-hole pressure, p wf 1 ¼ ductionwill fallasthe rateisincreased.If, however,the most
2,000 psia highly depleted layers themselves produce at high ratios
Tested production rate at p wf 1 , q 1 ¼ 500 stb=day because of high free gas saturations, the overall GOR will
Tested flowing bottom-hole pressure, p wf 2 ¼ eventually start to rise as the rate is increased and this climb
1,000 psia will be continued (after the most permeable zone has come
Tested production rate at p wf 2 , q 2 ¼ 800 stb=day onto production). Thus, it is to be expected that a well
producing from a stratified formation will exhibit a
Solution minimum GOR as the rate of production is increased.
One of the major concerns in a multiplayer system is
Vogel’s equation: that interlayer cross-flow may occur if reservoir fluids are
produced from commingled layers that have unequal ini-
q 1 tial pressures. This cross-flow greatly affects the composite
q max ¼ 2
1 0:2 p wf 1 0:8 p wf 1 IPR of the well, which may result in an optimistic estimate
p p p p of production rate from the commingled layers.
500 El-Banbi and Wattenbarger (1996, 1997) investigated
¼ 2 productivity of commingled gas reservoirs based on history
1 0:2 2;000 0:8 2;000
3;000 3;000 matching to production data. However, no information
was given in the papers regarding generation of IPR curves.
¼ 978 stb=day
Calculated data points are 3.5.1 Composite IPR Models
The following assumptions are made in this section:
p wf (psia) q (stb/day)
1. Pseudo–steady-state flow prevails in all the reservoir
0 978 layers.
500 924 2. Fluids from/into all the layers have similar properties.
1,000 826 3. Pressure losses in the wellbore sections between layers
1,500 685 are negligible (these pressure losses are considered in
2,000 500 Chapter 6 where multilateral wells are addressed).
2,500 272 4. The IPR of individual layers is known.
3,000 0
On the basis of Assumption 1, under steady-flow condi-
tions, the principle of material balance dictates
Fetkovich’s equation:
500 net mass flow rate from layers to the well
log q 1 log 800 ¼ mass flow rate at well head
n ¼ q 2 ¼ ! ¼ 1:0
2
p p 2 p 2 (3,000) (2,000) 2 or
log wf 1
p p 2 p 2 log n
wf 2 2 2 X
(3,000) (1,000)
r i q i ¼ r wh q wh , (3:36)
i¼1
q 1
C ¼
2
( p p 2 ) n where
p
wf 1
500 r i ¼ density of fluid from/into layer i,
¼
2
2 1:0
((3,000) (2,000) ) q i ¼ flow rate from/into layer i,
¼ 0:0001 stb=day-psi 2n r wh ¼ density of fluid at wellhead,
q wh ¼ flow rate at wellhead, and
Calculated data points are n ¼ number of layers.
Fluid flow from wellbore to reservoir is indicated by
p wf (psia) q (stb/day) negativeq i .UsingAssumption2andignoringdensitychange
0 900 from bottom hole to well head, Eq. (3.36) degenerates to
500 875 X
n
1,000 800 q i ¼ q wh (3:37)
1,500 675 i¼1
2,000 500 or
2,500 275 X
n
3,000 0 J i ( p i p wf ) ¼ q wh , (3:38)
p
i¼1
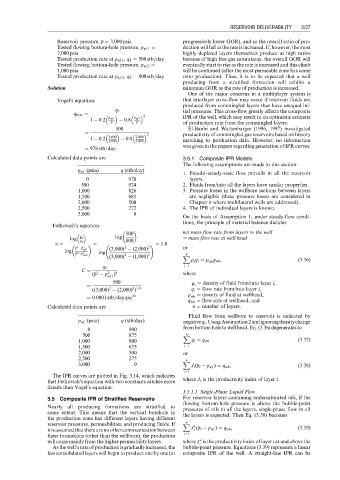
The IPR curves are plotted in Fig. 3.14, which indicates
that Fetkovich’s equation with two constants catches more where J i is the productivity index of layer i.
details than Vogel’s equation.
3.5.1.1 Single-Phase Liquid Flow
3.5 Composite IPR of Stratified Reservoirs For reservoir layers containing undersaturated oils, if the
flowing bottom-hole pressure is above the bubble-point
Nearly all producing formations are stratified to pressures of oils in all the layers, single-phase flow in all
some extent. This means that the vertical borehole in the layers is expected. Then Eq. (3.38) becomes
the production zone has different layers having different
n
reservoir pressures, permeabilities, and producing fluids. If X
p
itisassumedthattherearenoothercommunicationbetween J ( p i p wf ) ¼ q wh , (3:39)
i
these formations (other than the wellbore), the production i¼1
will come mainly from the higher permeability layers. where J is the productivity index of layer i at and above the
i
As the well’s rate of production is gradually increased, the bubble-point pressure. Equations (3.39) represents a linear
less consolidated layers will begin to produce one by one (at composite IPR of the well. A straight-line IPR can be