
Page 50 - Petroleum Production Engineering, A Computer-Assisted Approach
P. 50
Guo, Boyun / Computer Assited Petroleum Production Engg 0750682701_chap03 Final Proof page 40 3.1.2007 8:30pm Compositor Name: SJoearun
3/40 PETROLEUM PRODUCTION ENGINEERING FUNDAMENTALS
Table 3.2 Comparison of Commingled and Layer-Grouped Productions
Production rate (stb/day)
Grouped layers
Bottom-hole All layers
pressure (psi) commingled Group 1 Group 2 Group 3 Total
2,658 0 12,663 Shut-in Shut-in 12,663
2,625 7866 13,787 0 Shut-in 13,787
2,335 77,556 23,660 53,896 0 77,556
2,000 158,056 35,063 116,090 6,903 158,056
k ro
J B o m o f
f ¼ (3:50)
J k ro
p
B o m o p
or
k ro
B o m o f
J ¼ J : (3:51)
f
p
k ro
B o m o p
Thus,
" #
2
p
J p f p wf p wf
f
q ¼ 1 0:2 0:8 , (3:52)
1:8 p p f p p f
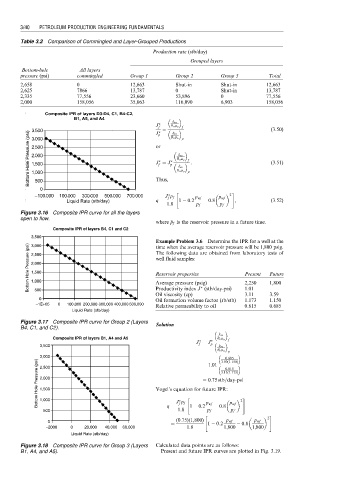
Figure 3.16 Composite IPR curve for all the layers
open to flow.
p
where p f is the reservoir pressure in a future time.
Composite IPR of layers B4, C1 and C2
3,500
Example Problem 3.6 Determine the IPR for a well at the
Bottom Hole Pressure (psi) 2,000 Reservoir properties Present Future
3,000
time when the average reservoir pressure will be 1,800 psig.
The following data are obtained from laboratory tests of
2,500
well fluid samples:
1,500
1,000
Average pressure (psig)
1.01
Productivity index J (stb/day-psi)
500
3.11
Oil viscosity (cp) 2,250 1,800
3.59
0 Oil formation volume factor (rb/stb) 1.173 1.150
−1E+05 0 100,000 200,000 300,000 400,000 500,000
Relative permeability to oil 0.815 0.685
Liquid Rate (stb/day)
Figure 3.17 Composite IPR curve for Group 2 (Layers
B4, C1, and C2). Solution
k ro
Composite IPR of layers B1, A4 and A5 B o m o f
J ¼ J
3,500 f p k ro
B o m o p
3,000 ¼ 1:01 3:59(1:150)
0:685
Bottom Hole Pressure (psi) 2,000 Vogel’s equation for future IPR:
2,500
0:815
3:11(1:173)
¼ 0:75 stb=day-psi
1,500
1,000
p
f
1:8
500 q ¼ J p f " 1 0:2 p wf 0:8 p wf 2 #
p p f
p p f
" 2 #
0 ¼ (0:75)(1,800) 1 0:2 p wf 0:8 p wf
−2000 0 20,000 40,000 60,000 1:8 1,800 1,800
Liquid Rate (stb/day)
Figure 3.18 Composite IPR curve for Group 3 (Layers Calculated data points are as follows:
B1, A4, and A5). Present and future IPR curves are plotted in Fig. 3.19.