
Page 49 - Petroleum Production Engineering, A Computer-Assisted Approach
P. 49
Guo, Boyun / Computer Assited Petroleum Production Engg 0750682701_chap03 Final Proof page 39 3.1.2007 8:30pm Compositor Name: SJoearun
RESERVOIR DELIVERABILITY 3/39
Table 3.1 Summary of Test Points for Nine Oil Layers
Layer no.: D3-D4 C1 B4-C2 B1 A5 A4
Layer pressure (psi) 3,030 2,648 2,606 2,467 2,302 2,254
Bubble point (psi) 26.3 4.1 4.1 56.5 31.2 33.8
Test rate (bopd) 3,200 3,500 3,510 227 173 122
Test pressure (psi) 2,936 2,607 2,571 2,422 2,288 2,216
J (bopd=psi) 34 85.4 100.2 5.04 12.4 3.2
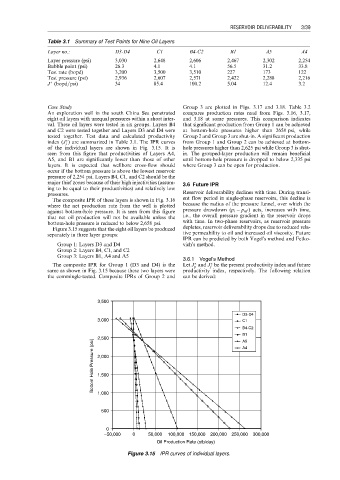
Case Study Group 3 are plotted in Figs. 3.17 and 3.18. Table 3.2
An exploration well in the south China Sea penetrated compares production rates read from Figs. 3.16, 3.17,
eight oil layers with unequal pressures within a short inter- and 3.18 at some pressures. This comparison indicates
val. These oil layers were tested in six groups. Layers B4 that significant production from Group 1 can be achieved
and C2 were tested together and Layers D3 and D4 were at bottom-hole pressures higher than 2658 psi, while
tested together. Test data and calculated productivity Group 2 and Group 3 are shut-in. A significant production
index (J ) are summarized in Table 3.1. The IPR curves from Group 1 and Group 2 can be achieved at bottom-
i
of the individual layers are shown in Fig. 3.15. It is hole pressures higher than 2,625 psi while Group 3 is shut-
seen from this figure that productivities of Layers A4, in. The grouped-layer production will remain beneficial
A5, and B1 are significantly lower than those of other until bottom-hole pressure is dropped to below 2,335 psi
layers. It is expected that wellbore cross-flow should where Group 3 can be open for production.
occur if the bottom pressure is above the lowest reservoir
pressure of 2,254 psi. Layers B4, C1, and C2 should be the
major thief zones because of their high injectivities (assum- 3.6 Future IPR
ing to be equal to their productivities) and relatively low
pressures. Reservoir deliverability declines with time. During transi-
The composite IPR of these layers is shown in Fig. 3.16 ent flow period in single-phase reservoirs, this decline is
where the net production rate from the well is plotted because the radius of the pressure funnel, over which the
against bottom-hole pressure. It is seen from this figure pressure drawdown (p i p wf ) acts, increases with time,
that net oil production will not be available unless the i.e., the overall pressure gradient in the reservoir drops
bottom-hole pressure is reduced to below 2,658 psi. with time. In two-phase reservoirs, as reservoir pressure
Figure 3.15 suggests that the eight oil layers be produced depletes, reservoir deliverability drops due to reduced rela-
separately in three layer groups: tive permeability to oil and increased oil viscosity. Future
IPR can be predicted by both Vogel’s method and Fetko-
Group 1: Layers D3 and D4 vich’s method.
Group 2: Layers B4, C1, and C2
Group 3: Layers B1, A4 and A5
3.6.1 Vogel’s Method
The composite IPR for Group 1 (D3 and D4) is the Let J and J be the present productivity index and future
p
f
same as shown in Fig. 3.15 because these two layers were productivity index, respectively. The following relation
the commingle-tested. Composite IPRs of Group 2 and can be derived:
3,500
D3-D4
3,000 C1
B4-C2
B1
2,500 A5
Bottom Hole Pressure (psi) 2,000
A4
1,500
1,000
500
0
−50,000 0 50,000 100,000 150,000 200,000 250,000 300,000
Oil Production Rate (stb/day)
Figure 3.15 IPR curves of individual layers.