
Page 74 - Petroleum Production Engineering, A Computer-Assisted Approach
P. 74
Guo, Boyun / Petroleum Production Engineering, A Computer-Assisted Approach 0750682701_chap05 Final Proof page 65 21.12.2006 2:02pm
CHOKE PERFORMANCE 5/65
The actual pressure ratio can be calculated by The total mass flux can be calculated using the following
equation:
p 2
y a ¼ , (5:16)
p 1 0:5
(1 x 1 )(1 y) x 1 k
2
where G 2 ¼ C D 288g c p 1 r m2 þ (V G1 yV G2 ) ,
r L k 1
y a ¼ actual pressure ratio (5:17)
p 1 ¼ upstream pressure, psia
p 2 ¼ downstream pressure, psia where
2
G 2 ¼ mass flux at downstream, lbm=ft =s
If y a < y c , critical flow exists, and the y c should be used C D ¼ discharge coefficient, 0.62–0.90
(y ¼ y c ). Otherwise, subcritical flow exists, and y a should r m2 ¼ mixture density at downstream, lbm=ft 3
be used (y ¼ y a ). 3
r L ¼ liquid density, lbm=ft
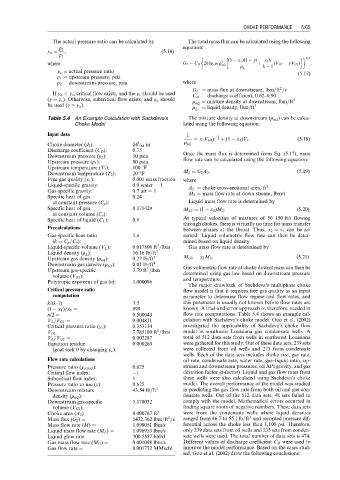
Table 5.4 An Example Calculation with Sachdeva’s The mixture density at downstream (r m2 ) can be calcu-
Choke Model lated using the following equation:
Input data 1 1
¼ x 1 V G1 y k þ (1 x 1 )V L (5:18)
1
Choke diameter (d 2 ): 24 ⁄ 64 in. r m2
Discharge coefficient (C D ): 0.75
Downstream pressure (p 2 ): 50 psia Once the mass flux is determined from Eq. (5.17), mass
Upstream pressure (p 1 ): 80 psia flow rate can be calculated using the following equation:
Upstream temperature (T 1 ): 100 8F
Downstream temperature (T 2 ): 20 8F M 2 ¼ G 2 A 2 , (5:19)
Free gas quality (x 1 ): 0.001 mass fraction where
Liquid-specific gravity: 0.9 water ¼ 1 A 2 ¼ choke cross-sectional area, ft 2
Gas-specific gravity: 0.7 air ¼ 1 M 2 ¼ mass flow rate at down stream, lbm/s
Specific heat of gas 0.24
at constant pressure (C p ): Liquid mass flow rate is determined by
Specific heat of gas 0.171429 M L2 ¼ (1 x 2 )M 2 : (5:20)
at constant volume (C v ):
Specific heat of liquid (C L ): 0.8 At typical velocities of mixtures of 50–150 ft/s flowing
through chokes, there is virtually no time for mass transfer
Precalculations between phases at the throat. Thus, x 2 ¼ x 1 can be as-
Gas-specific heat ratio 1.4 sumed. Liquid volumetric flow rate can then be deter-
(k ¼ C p =C v ): mined based on liquid density.
3
Liquid-specific volume (V L ): 0.017806 ft =lbm Gas mass flow rate is determined by
Liquid density (r L ): 56.16 lb=ft 3
Upstream gas density (r G1 ): 0.27 lb=ft 3 M G2 ¼ x 2 M 2 : (5:21)
Downstream gas density (r G2 ): 0.01 lb=ft 4
3
Upstream gas-specific 3.70 ft =lbm Gas volumetric flow rate at choke downstream can then be
determined using gas law based on downstream pressure
volume (V G1 ):
and temperature.
Polytropic exponent of gas (n): 1.000086
The major drawback of Sachdeva’s multiphase choke
Critical pressure ratio flow model is that it requires free gas quality as an input
computation parameter to determine flow regime and flow rates, and
k/(k-1) ¼ 3.5 this parameter is usually not known before flow rates are
(1 x 1 )=x 1 ¼ 999 known. A trial-and-error approach is, therefore, needed in
n/2 ¼ 0.500043 flow rate computations. Table 5.4 shows an example cal-
V L =V G1 ¼ 0.004811 culation with Sachdeva’s choke model. Guo et al. (2002)
Critical pressure ratio (y c ): 0.353134 investigated the applicability of Sachdeva’s choke flow
3
V G2 ¼ 7.785109 ft =lbm model in southwest Louisiana gas condensate wells. A
V L =V G2 ¼ 0.002287 total of 512 data sets from wells in southwest Louisiana
Equation residue 0.000263 were gathered for this study. Out of these data sets, 239 sets
(goal seek 0 by changing y c ): were collected from oil wells and 273 from condensate
wells. Each of the data sets includes choke size, gas rate,
Flow rate calculations oil rate, condensate rate, water rate, gas–liquid ratio, up-
Pressure ratio (y actual ): 0.625 stream and downstream pressures, oil API gravity, and gas
Critical flow index: 1 deviation factor (z-factor). Liquid and gas flow rates from
Subcritical flow index: 1 these wells were also calculated using Sachdeva’s choke
Pressure ratio to use (y): 0.625 model. The overall performance of the model was studied
Downstream mixture 43.54 lb=ft 3 in predicting the gas flow rate from both oil and gas con-
density (r m2 ): densate wells. Out of the 512 data sets, 48 sets failed to
Downstream gas-specific 5.178032 comply with the model. Mathematical errors occurred in
volume (V G2 ): finding square roots of negative numbers. These data sets
Choke area (A 2 ) ¼ 0.000767 ft 2 were from the condensate wells where liquid densities
3
2
Mass flux (G 2 ) ¼ 1432.362 lbm=ft =s ranged from 46.7 to 55:1lb=ft and recorded pressure dif-
Mass flow rate (M) ¼ 1.098051 lbm/s ferential across the choke less than 1,100 psi. Therefore,
Liquid mass flow rate (M L ) ¼ 1.096953 lbm/s only 239 data sets from oil wells and 235 sets from conden-
Liquid glow rate ¼ 300.5557 bbl/d sate wells were used. The total number of data sets is 474.
Gas mass flow rate (M G ) ¼ 0.001098 lbm/s Different values of discharge coefficient C D were used to
Gas flow rate ¼ 0.001772 MMscfd improve the model performance. Based on the cases stud-
ied, Guo et al. (2002) draw the following conclusions: