
Page 213 - A Comprehensive Guide to Solar Energy Systems
P. 213
216 A ComPRehenSIVe GuIDe To SolAR eneRGy SySTemS
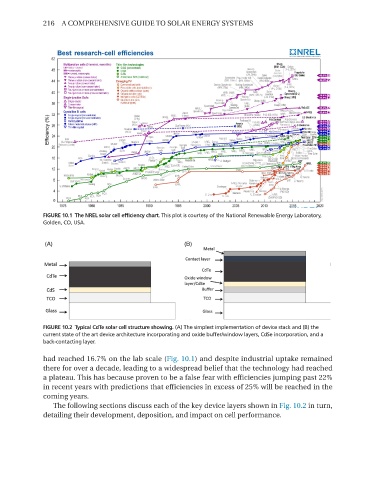
FIGURE 10.1 The NREL solar cell efficiency chart. This plot is courtesy of the National Renewable Energy Laboratory,
Golden, CO, USA.
FIGURE 10.2 Typical CdTe solar cell structure showing. (A) The simplest implementation of device stack and (B) the
current state of the art device architecture incorporating and oxide buffer/window layers, CdSe incorporation, and a
back-contacting layer.
had reached 16.7% on the lab scale (Fig. 10.1) and despite industrial uptake remained
there for over a decade, leading to a widespread belief that the technology had reached
a plateau. This has because proven to be a false fear with efficiencies jumping past 22%
in recent years with predictions that efficiencies in excess of 25% will be reached in the
coming years.
The following sections discuss each of the key device layers shown in Fig. 10.2 in turn,
detailing their development, deposition, and impact on cell performance.