
Page 163 - Acquisition and Processing of Marine Seismic Data
P. 163
154 2. MARINE SEISMIC DATA ACQUISITION
the vessel’s water speed. Periodical analysis of to fill in the missing offsets within the bins with
ADCP data in 2D along the acquisition area as data gaps using neighboring bins to obtain a
it is collected during the survey can provide more regular fold distribution (Section 8.3). At
information to predict the predominated current the end of the survey, a complete map of cover-
direction and streamer feathering, and hence, age is obtained and the gaps in fold distribution
can be used to improve the survey design and due to the acquisition problems such as rough
parameters. Fig. 2.98C shows an example of an weather conditions or obstacles in the survey
average current direction plot from ADCP data area are determined. Such gaps need additional
on a sequence-by-sequence basis. work, termed infill shots, which affect the over-
The seismic sail line plot (the preplot lines) all time schedule of the survey (Section 2.5.1.8).
prepared before the survey is entered into the Final fold distribution is analyzed in terms of
INS for line steering. However, it is commonly required infill shots after bin-flexing to fill the
not possible to steer the vessel along the preplot missing offsets in adjacent crossline bins in a
lines perfectly because of the local weather and constrained manner. Several tests to determine
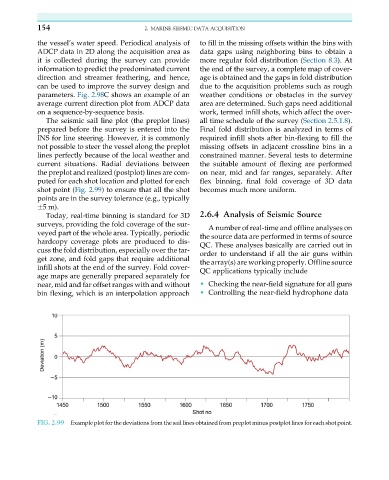
current situations. Radial deviations between the suitable amount of flexing are performed
the preplot and realized (postplot) lines are com- on near, mid and far ranges, separately. After
puted for each shot location and plotted for each flex binning, final fold coverage of 3D data
shot point (Fig. 2.99) to ensure that all the shot becomes much more uniform.
points are in the survey tolerance (e.g., typically
5 m).
Today, real-time binning is standard for 3D 2.6.4 Analysis of Seismic Source
surveys, providing the fold coverage of the sur- A number of real-time and offline analyses on
veyed part of the whole area. Typically, periodic the source data are performed in terms of source
hardcopy coverage plots are produced to dis- QC. These analyses basically are carried out in
cuss the fold distribution, especially over the tar- order to understand if all the air guns within
get zone, and fold gaps that require additional the array(s) are working properly. Offline source
infill shots at the end of the survey. Fold cover- QC applications typically include
age maps are generally prepared separately for
near, mid and far offset ranges with and without • Checking the near-field signature for all guns
bin flexing, which is an interpolation approach • Controlling the near-field hydrophone data
FIG. 2.99 Example plot for the deviations from the sail lines obtained from preplot minus postplot lines for each shot point.