
Page 164 - Acquisition and Processing of Marine Seismic Data
P. 164
2.6 QC IN DATA ACQUISITION 155
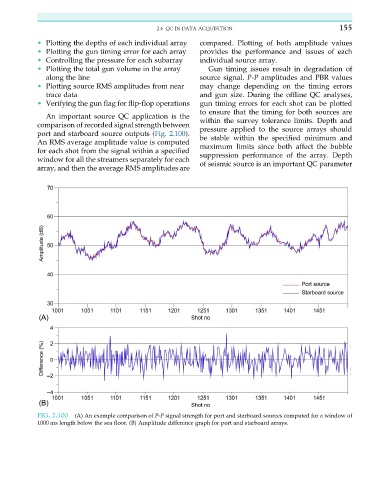
• Plotting the depths of each individual array compared. Plotting of both amplitude values
• Plotting the gun timing error for each array provides the performance and issues of each
• Controlling the pressure for each subarray individual source array.
• Plotting the total gun volume in the array Gun timing issues result in degradation of
along the line source signal. P-P amplitudes and PBR values
• Plotting source RMS amplitudes from near may change depending on the timing errors
trace data and gun size. During the offline QC analyses,
• Verifying the gun flag for flip-flop operations gun timing errors for each shot can be plotted
to ensure that the timing for both sources are
An important source QC application is the
within the survey tolerance limits. Depth and
comparison of recorded signal strength between
pressure applied to the source arrays should
port and starboard source outputs (Fig. 2.100).
be stable within the specified minimum and
An RMS average amplitude value is computed
maximum limits since both affect the bubble
for each shot from the signal within a specified
suppression performance of the array. Depth
window for all the streamers separately for each
of seismic source is an important QC parameter
array, and then the average RMS amplitudes are
FIG. 2.100 (A) An example comparison of P-P signal strength for port and starboard sources computed for a window of
1000 ms length below the sea floor. (B) Amplitude difference graph for port and starboard arrays.