
Page 309 - Acquisition and Processing of Marine Seismic Data
P. 309
300 5. PREPROCESSING
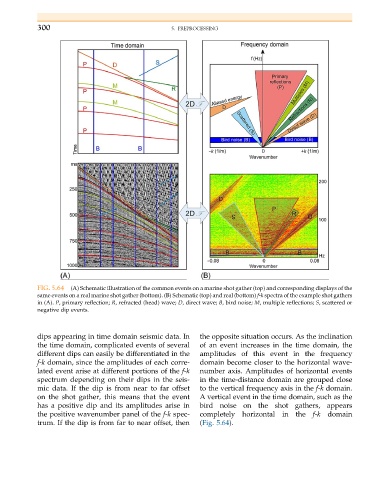
FIG. 5.64 (A) Schematic illustration of the common events on a marine shot gather (top) and corresponding displays of the
same events on a real marine shot gather (bottom). (B) Schematic (top) and real (bottom) f-k spectra of the example shot gathers
in (A). P, primary reflection; R, refracted (head) wave; D, direct wave; B, bird noise; M, multiple reflections; S, scattered or
negative dip events.
dips appearing in time domain seismic data. In the opposite situation occurs. As the inclination
the time domain, complicated events of several of an event increases in the time domain, the
different dips can easily be differentiated in the amplitudes of this event in the frequency
f-k domain, since the amplitudes of each corre- domain become closer to the horizontal wave-
lated event arise at different portions of the f-k number axis. Amplitudes of horizontal events
spectrum depending on their dips in the seis- in the time-distance domain are grouped close
mic data. If the dip is from near to far offset to the vertical frequency axis in the f-k domain.
on the shot gather, this means that the event A vertical event in the time domain, such as the
has a positive dip and its amplitudes arise in bird noise on the shot gathers, appears
the positive wavenumber panel of the f-k spec- completely horizontal in the f-k domain
trum. If the dip is from far to near offset, then (Fig. 5.64).