
Page 308 - Acquisition and Processing of Marine Seismic Data
P. 308
5.9 f-k DIP FILTERS 299
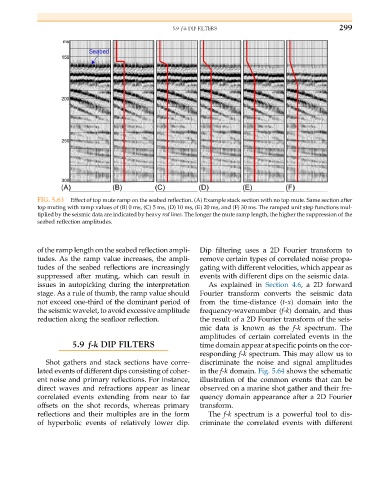
FIG. 5.63 Effect of top mute ramp on the seabed reflection. (A) Example stack section with no top mute. Same section after
top muting with ramp values of (B) 0 ms, (C) 5 ms, (D) 10 ms, (E) 20 ms, and (F) 30 ms. The ramped unit step functions mul-
tiplied by the seismic data are indicated by heavy red lines. The longer the mute ramp length, the higher the suppression of the
seabed reflection amplitudes.
of the ramp length on the seabed reflection ampli- Dip filtering uses a 2D Fourier transform to
tudes. As the ramp value increases, the ampli- remove certain types of correlated noise propa-
tudes of the seabed reflections are increasingly gating with different velocities, which appear as
suppressed after muting, which can result in events with different dips on the seismic data.
issues in autopicking during the interpretation As explained in Section 4.6, a 2D forward
stage. As a rule of thumb, the ramp value should Fourier transform converts the seismic data
not exceed one-third of the dominant period of from the time-distance (t-x) domain into the
the seismic wavelet, to avoid excessive amplitude frequency-wavenumber (f-k) domain, and thus
reduction along the seafloor reflection. the result of a 2D Fourier transform of the seis-
mic data is known as the f-k spectrum. The
amplitudes of certain correlated events in the
5.9 f-k DIP FILTERS time domain appear at specific points on the cor-
responding f-k spectrum. This may allow us to
Shot gathers and stack sections have corre- discriminate the noise and signal amplitudes
lated events of different dips consisting of coher- in the f-k domain. Fig. 5.64 shows the schematic
ent noise and primary reflections. For instance, illustration of the common events that can be
direct waves and refractions appear as linear observed on a marine shot gather and their fre-
correlated events extending from near to far quency domain appearance after a 2D Fourier
offsets on the shot records, whereas primary transform.
reflections and their multiples are in the form The f-k spectrum is a powerful tool to dis-
of hyperbolic events of relatively lower dip. criminate the correlated events with different