
Page 313 - Acquisition and Processing of Marine Seismic Data
P. 313
304 5. PREPROCESSING
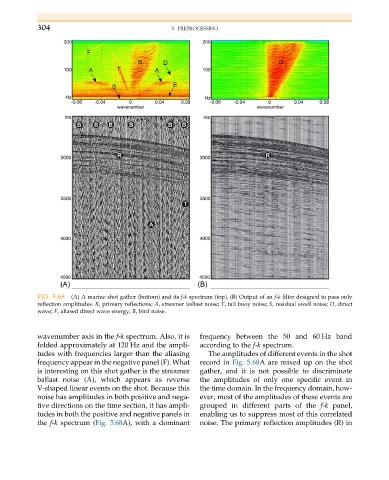
FIG. 5.68 (A) A marine shot gather (bottom) and its f-k spectrum (top). (B) Output of an f-k filter designed to pass only
reflection amplitudes. R, primary reflections; A, streamer ballast noise; T, tail buoy noise; S, residual swell noise; D, direct
wave; F, aliased direct wave energy; B, bird noise.
wavenumber axis in the f-k spectrum. Also, it is frequency between the 50 and 60 Hz band
folded approximately at 120 Hz and the ampli- according to the f-k spectrum.
tudes with frequencies larger than the aliasing The amplitudes of different events in the shot
frequency appear in the negative panel (F). What record in Fig. 5.68A are mixed up on the shot
is interesting on this shot gather is the streamer gather, and it is not possible to discriminate
ballast noise (A), which appears as reverse the amplitudes of only one specific event in
V-shaped linear events on the shot. Because this the time domain. In the frequency domain, how-
noise has amplitudes in both positive and nega- ever, most of the amplitudes of these events are
tive directions on the time section, it has ampli- grouped in different parts of the f-k panel,
tudes in both the positive and negative panels in enabling us to suppress most of this correlated
the f-k spectrum (Fig. 5.68A), with a dominant noise. The primary reflection amplitudes (R) in