
Page 315 - Acquisition and Processing of Marine Seismic Data
P. 315
306 5. PREPROCESSING
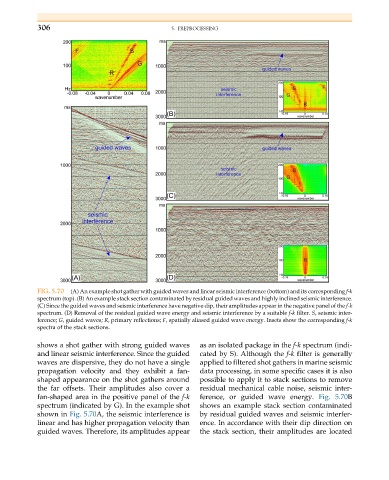
FIG. 5.70 (A) An example shot gather with guided waves and linear seismic interference (bottom) and its corresponding f-k
spectrum (top). (B) An example stack section contaminated by residual guided waves and highly inclined seismic interference.
(C) Since the guided waves and seismic interference have negative dip, their amplitudes appear in the negative panel of the f-k
spectrum. (D) Removal of the residual guided wave energy and seismic interference by a suitable f-k filter. S, seismic inter-
ference; G, guided waves; R, primary reflections; F, spatially aliased guided wave energy. Insets show the corresponding f-k
spectra of the stack sections.
shows a shot gather with strong guided waves as an isolated package in the f-k spectrum (indi-
and linear seismic interference. Since the guided cated by S). Although the f-k filter is generally
waves are dispersive, they do not have a single applied to filtered shot gathers in marine seismic
propagation velocity and they exhibit a fan- data processing, in some specific cases it is also
shaped appearance on the shot gathers around possible to apply it to stack sections to remove
the far offsets. Their amplitudes also cover a residual mechanical cable noise, seismic inter-
fan-shaped area in the positive panel of the f-k ference, or guided wave energy. Fig. 5.70B
spectrum (indicated by G). In the example shot shows an example stack section contaminated
shown in Fig. 5.70A, the seismic interference is by residual guided waves and seismic interfer-
linear and has higher propagation velocity than ence. In accordance with their dip direction on
guided waves. Therefore, its amplitudes appear the stack section, their amplitudes are located