
Page 333 - Acquisition and Processing of Marine Seismic Data
P. 333
324 6. DECONVOLUTION
FIG. 6.11 Autocorrelation functions of (A) minimum phase wavelet w(t), and (B) minimum phase seismogram s(t). Auto-
correlations of both source wavelet and seismogram show similar characteristics for the initial parts (blue shaded areas).
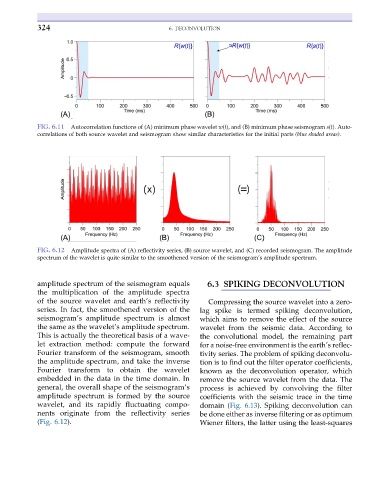
FIG. 6.12 Amplitude spectra of (A) reflectivity series, (B) source wavelet, and (C) recorded seismogram. The amplitude
spectrum of the wavelet is quite similar to the smoothened version of the seismogram’s amplitude spectrum.
amplitude spectrum of the seismogram equals 6.3 SPIKING DECONVOLUTION
the multiplication of the amplitude spectra
of the source wavelet and earth’s reflectivity Compressing the source wavelet into a zero-
series. In fact, the smoothened version of the lag spike is termed spiking deconvolution,
seismogram’s amplitude spectrum is almost which aims to remove the effect of the source
the same as the wavelet’s amplitude spectrum. wavelet from the seismic data. According to
This is actually the theoretical basis of a wave- the convolutional model, the remaining part
let extraction method: compute the forward for a noise-free environment is the earth’s reflec-
Fourier transform of the seismogram, smooth tivity series. The problem of spiking deconvolu-
the amplitude spectrum, and take the inverse tion is to find out the filter operator coefficients,
Fourier transform to obtain the wavelet known as the deconvolution operator, which
embedded in the data in the time domain. In remove the source wavelet from the data. The
general, the overall shape of the seismogram’s process is achieved by convolving the filter
amplitude spectrum is formed by the source coefficients with the seismic trace in the time
wavelet, and its rapidly fluctuating compo- domain (Fig. 6.13). Spiking deconvolution can
nents originate from the reflectivity series be done either as inverse filtering or as optimum
(Fig. 6.12). Wiener filters, the latter using the least-squares